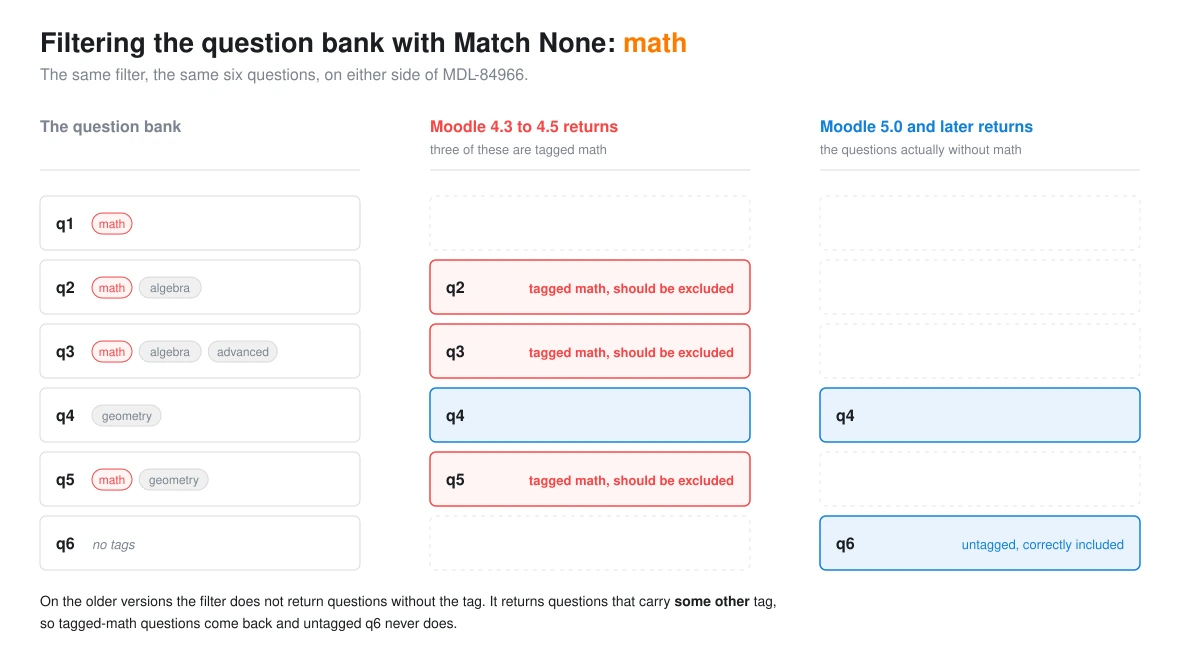
The Moodle question bank filters by tag, and the Tag row carries a Match dropdown with None, Any and All. Match None is the one to reach for when a pool has to exclude something: every question in the bank except those tagged retired, say, or a random question that must never draw from a set that has been withdrawn.
On Moodle 4.3, 4.4 and 4.5, that is not what it returns. Depending on how the bank is tagged, the result is either empty or a list that still contains the very questions the filter was written to keep out. It behaves this way on the question bank screen and in random question selection alike, because both run the same code.
The second case is the one that matters, because nothing on screen indicates that anything went wrong.
Check whether you are affected in 30 seconds
Pick a question that carries two tags, for example retired and chapter1. Filter the question bank with Match set to None and retired selected.
If that question appears in the results, you are on an affected version.
If it does not appear, and untagged questions do, your filter is working correctly.
If you have not used Match None, you are not affected. Only the None option is involved: Any and All behave the same on 4.3 as they do on 5.2.
What the filter actually returns
On the affected versions, Match None does not mean “questions without the selected tag”. It means “questions that carry at least one tag that is not the selected one”. Those are different sets, and two consequences follow.
Questions you excluded come back anyway. A question tagged both retired and chapter1 satisfies that rule, because chapter1 is not retired. It appears in your “none” result despite being tagged retired.
Untagged questions never appear. A question with no tags at all carries no tag that is not the selected one, so it is always excluded, even though it plainly has none of the tags you picked.
Moodle’s own test fixture shows the difference. Six questions:
Question
Tags
q1
math
q2
math, algebra
q3
math, algebra, advanced
q4
geometry
q5
math, geometry
q6
(none)
Filtering with Match None:
Filter
4.3 to 4.5 returns
5.0 and later returns
None: math
q2, q3, q4, q5
q4, q6
None: math + geometry
q2, q3
q6
None: algebra
q1, q2, q3, q4, q5
q1, q4, q5, q6
In the first row, three of the four questions the older versions return are tagged math. That is the exact set the filter was asked to exclude.
This is also why the symptom looks different from site to site. If every question in your bank carries exactly one tag and you filter on it, everything fails the rule and you get an empty list, which at least looks like a problem. If your questions carry several tags, you get a full-looking result that is quietly wrong.
Which versions are fixed
The fix is MDL-84966. It landed in 5.0, 5.1 and 5.2, and was not backported to 4.5 or earlier.
Version
Match None
General support ends
Security support ends
4.5 LTS
Broken
2025-10-06
2027-10-04
5.0
Fixed
2026-04-20 (passed)
2026-10-05
5.1
Fixed
2026-10-05
2027-04-19
5.2
Fixed
2027-04-19
2027-10-04
If you are already on 5.0 or later, Match None does what the label says and there is nothing to do.
If you are upgrading in order to resolve this, go to the latest Moodle release your site can take, rather than to the earliest version that carries the fix. Check its PHP requirement and its supported upgrade path first: Moodle does not support an unlimited jump, so a site on an older 4.x may need an intermediate step.
Note that 4.5 is the current LTS, with security support running to October 2027. Many sites will legitimately stay on it for another year or more. Unless they apply a tested local backport of the fix, those sites keep this behavior for as long as they stay on 4.5, which is what makes the workaround below worth setting up.
The workaround: tag what you want, not what you don’t
If you cannot upgrade, stop expressing the rule as an exclusion. Add a second tag to the questions you do want, for example active, and filter with Match Any on active.
Be clear about what this changes. You are swapping the rule “everything except retired” for the rule “everything tagged active“. Those are not the same rule, and they only stay equivalent if you maintain the active tag deliberately. It is the safest workaround that needs no code, for three reasons.
It works before and after the fix. Any and All are not affected by this bug, so the same configuration behaves the same on 4.3 as on 5.2 and survives the upgrade without being unpicked.
It fails visibly rather than silently. This is the real argument. Both rules can go wrong, but they go wrong in different ways. If somebody forgets to tag a new question active, it is missing from a pool that is supposed to contain it, and that tends to get noticed. The broken exclusion rule quietly hands out questions you meant to withhold, and nothing reports it.
It behaves the same in quizzes. Random question criteria run through the same filtering code as the bank screen, so a positive tag is predictable in both places.
The maintenance cost is real, so plan for it. A new question that belongs in the pool has to be tagged, and a question that carries both retired and active lands back in the pool you were trying to protect. Both are worth a periodic check.
On the other approaches: moving questions into a separate category is a perfectly reasonable design when the pools are genuinely disjoint, and only becomes awkward when a question needs to belong to more than one. Filtering with Match Any across every other tag works until somebody adds a tag, at which point the pool changes without anyone touching the quiz. Removing the retired tag destroys information you presumably wanted to keep.
If you are staying on 4.5 and lean on exclusion filters heavily, a tested local backport of the MDL-84966 patch is the other option. It restores the intended behavior rather than working around it, at the cost of carrying a core patch across every future update.
This is not confined to the question bank screen
The same filtering code drives random question selection in quizzes. When a learner starts an attempt, Moodle reads the slot’s stored filter and asks the question loader for a question, and that loader builds its query with exactly the same code the bank screen uses. There is no separate implementation for quizzes.
So on 4.3 through 4.5, a random question configured with a Match None tag criterion has been drawing from an incorrectly defined pool. What that means in practice depends on your tag data: the pool may include questions the criterion was written to keep out, it may omit questions that should have been eligible, and where a single tag is used throughout the bank it may be empty. The pool definition is wrong on every attempt, which is not the same as saying every attempt served an excluded question.
If you already built a pool this way
Any quiz on an affected version using a random question with a Match None tag criterion is worth checking. If the excluded questions were excluded for a reason, for instance because they are reserved for a final assessment, they may already have been served to learners. Nothing in the quiz or the bank reports this. The filter returns a plausible looking set and the attempt proceeds normally.
A practical order to work through it:
Find the affected slots. Random question criteria are stored as JSON in question_set_references.filtercondition. The tag filter is keyed qtagids, and Match None is jointype 0. This query finds candidates:
Read the matches before acting on them. The LIKE will also match a jointype 0 belonging to a different condition in the same JSON, so confirm that the 0 sits inside the qtagids object.
Work out the gap. For each affected slot, compare what the criterion was meant to select against what the buggy rule actually returns for your tag data.
Then look at attempts, to see whether any of the wrongly included questions were actually served.
If no current random-question slot uses Match None, there is no live quiz configuration to remediate. That is not quite the same as saying nothing ever went out: a slot that was configured this way and has since been edited or deleted leaves no trace in the current configuration, so if the stakes are high enough, the attempt data is the only place that would still show it.
Under the hood
This section explains the cause in the source. You do not need any of it to apply the fix above, so skip it if you just want the pool working.
The Tag filter builds its SQL in question/bank/tagquestion/classes/tag_condition.php. On 4.3 through 4.5, choosing None flips the comparison inside the subquery:
q.id IN (SELECT ti.itemid
           FROM {tag_instance} ti
          WHERE ti.itemtype = 'question'
            AND ti.component = 'core_question'
            AND ti.tagid NOT IN (:selected)
       GROUP BY ti.itemid)
Read that carefully. It selects questions that have a tag row whose tag is not the selected one. A question tagged retired and chapter1 has such a row, so it matches. A question with no tags has no rows at all, so it cannot match. Both surprises fall straight out of the query.
From 5.0 onward the negation moved to the outer clause, which is what the label means:
q.id NOT IN (SELECT ti.itemid
               FROM {tag_instance} ti
              WHERE ti.itemtype = 'question'
                AND ti.component = 'core_question'
                AND ti.tagid IN (:selected
The negation is the whole difference: negating set membership is not the same as negating the comparison used to build the set.
Worth noting for anyone maintaining plugins in this area, because it explains how a bug like this can go unnoticed rather than why this particular one did: there were no unit tests for this condition until the fix added tag_condition_test.php. A wrong-results bug with no assertion covering it produces no failing build, and because the filter still returns something, it produces no visible error either. Those two together are what let a defect sit in a shipped feature.
You open a course page and it is visibly broken. Everything looks fine at the top, then partway down the layout collapses: activities shift sideways, blocks jump to the wrong column, sections sit inside one another, or the whole right-hand side disappears. The activities at the top are untouched; everything below a certain point is mangled. Clearing caches and switching themes makes no difference. This guide explains what causes that specific failure and how to fix it.
What you are looking at
The tell-tale sign is that the breakage starts at a point on the page and affects everything after it, while everything before it is fine. That points to a single unclosed or malformed HTML tag in one piece of content, an unclosed <div>, <table>, or <p>, usually pasted in from Microsoft Word. Moodle renders a course page as one continuous HTML document, so an unbalanced tag in one activity does not stay contained: the browser keeps the tag “open” and every subsequent activity gets pulled inside it, which is why the damage cascades downward from one point.
The content that introduced it often looks completely normal in the editor. The visible damage appears further down the page, in activities that have nothing to do with the one that actually contains the broken tag. That mismatch is what makes this so confusing to diagnose by eye.
The thing most people miss first
Before hunting for the bad tag, check one setting, because on a standard Moodle site this symptom should not be possible at all.
By default, Moodle runs all HTML content through a cleaner (HTMLPurifier) before displaying it. That cleaner automatically closes unclosed tags and fixes broken nesting, so a malformed Word paste is repaired before it ever reaches the page. On a default site, the cascade described above simply does not happen.
It becomes possible only when “Enable trusted text” is switched on. That setting tells Moodle to skip the cleaning for content authored by trusted roles (anyone with the moodle/site:trustcontent capability), so that those users can use advanced markup the cleaner would otherwise strip. The side effect: their malformed markup is no longer auto-repaired, and a single unclosed tag now breaks the page exactly as you are seeing.
So the first move is to check it:
Site administration > Security > Site security settings > Enable trusted text.
If it is on, you have found the condition that allows the breakage. You now have two routes: turn the setting off (the broad fix), or find and fix the offending tag (the surgical fix). Often you want both, the setting change to prevent recurrence, the tag fix to repair the page that is already broken.
The broad fix: turn trusted text off
If your site does not actually need trusted text (most do not, it exists to allow scripts and embeds that the cleaner removes), turning it off restores Moodle’s automatic tag-balancing for all content. Existing malformed content then gets cleaned on render, and the layout repairs itself without you touching any individual activity.
Weigh this before flipping it: if trusted authors rely on embedded markup (custom scripts, certain iframes), turning trusted text off will strip that markup. If you are not knowingly using that capability, it is safe and is the cleanest prevention.
The surgical fix: find and repair the bad tag
If you need to keep trusted text on, or you want to repair the specific page, locate the unbalanced tag:
View the page source (Ctrl+U in Chrome or Firefox). Scan for an opened <div> or <table> with no matching close near where the layout starts to break.
Use developer tools (F12), Elements panel. The browser auto-corrects malformed markup as it builds the DOM; the point where its correction diverges from what you intended usually sits right at the broken tag.
The W3C validator (validator.w3.org) can check markup, but its “validate by URL” mode cannot reach a login-protected course page. Use “validate by direct input” and paste the page source instead.
The activity to fix is the one whose content holds the unclosed structural tag, frequently a Label, Page, or Text and media area where formatted content was pasted. Edit it, switch the editor to its HTML source view (in TinyMCE, the HTML source-code button), close or remove the unbalanced tag, and save. If the editor keeps re-mangling the markup, set your editor preference to Plain text area temporarily, correct the raw HTML, and save. Reload the course page: the layout below the fixed content should be restored.
Preventing it from happening again
The most reliable prevention is to stop malformed Word markup entering content at all. Tell authors to paste as plain text (Ctrl+Shift+V pastes without source formatting in most browsers) and apply formatting in the editor afterwards.
If you do not have a genuine need for trusted content, leave “Enable trusted text” off. That single setting is the difference between Moodle quietly repairing a bad paste and a bad paste taking down half a course page.
The short version
A course page that breaks from one point downward is almost always a single unclosed HTML tag in pasted content, and on a healthy Moodle site it should not happen, because Moodle cleans HTML by default. If it is happening, “Enable trusted text” is switched on and is bypassing that cleaning. Check that setting first: turn it off to fix the whole class of problem, and fix the offending activity’s HTML to repair the page that is already broken.
You deploy a code update or upgrade to a Moodle site, and afterwards the Edit mode toggle does nothing. You click it, the page reloads, and you are still not in editing mode (or the editing controls never appear). The site otherwise loads fine. This is almost always a stale JavaScript or theme cache, not a code problem, and it clears in a couple of minutes once you know what to purge.
Why a deployment causes it
Moodle serves its interface JavaScript and theme CSS from caches keyed on a revision number. When you deploy new code, the files on disk change, but browsers and the server may still be holding the previous cached versions. The Edit mode toggle is driven by a JavaScript module (an AMD module that calls a web service to flip your editing state). If the browser is running stale or half-updated JavaScript, the toggle silently fails to do its job even though the rest of the page renders normally.
This is why it specifically shows up after a deploy: the HTML and PHP are new, but the JS/theme layer is still cached from before. The fix is to force those caches to regenerate.
The fix, in order
1. Purge all caches. This is the single most likely fix. From the command line:
sudo -u www-data php admin/cli/purge_caches.php
Or, in the UI: Site administration > Development > Purge caches. This rebuilds the JavaScript and theme caches with a fresh revision, so browsers are served the new code.
2. Hard-refresh the browser. After purging server-side, your browser may still hold the old JavaScript. Do a hard reload (Ctrl+Shift+R, or Cmd+Shift+R on macOS) on the page where Edit mode is broken. A normal refresh is not always enough because the cached JS can be served from the browser’s own cache.
3. Reset the opcache if your server uses it. On a production server with opcache.validate_timestamps=0 (common on tuned hosts), PHP keeps serving the old compiled code until opcache is reset, which a cache purge does not do. Reload PHP-FPM (or the web server) to clear it. If you are not sure whether this applies, restarting the PHP service after a deploy is a safe habit.
After these three, click Edit mode again. In the overwhelming majority of cases it now works.
Confirming it is a JavaScript/cache issue
If you want to verify the cause rather than just apply the fix, open your browser’s developer tools (F12), go to the Console and Network tabs, and click the Edit mode toggle:
A failed request to Moodle’s AJAX service endpoint (/lib/ajax/service.php), or a JavaScript error in the console, confirms the JS layer is the problem.
A clean network log with no toggle request firing at all points to the JavaScript module not loading, again a cache/build issue.
Either way, the remedy is the cache purge and hard refresh above.
If it still does not work
A few less common causes, worth checking only after the cache steps:
Development cache settings left on. If $CFG->cachejs = false or $CFG->themedesignermode = true is set in config.php, JavaScript and theme assets are rebuilt on every request, which is slow and can serve inconsistent assets under load. These are explicitly “not for production servers”; remove them on a live site.
A theme that failed to compile. If the deploy included a theme change and the theme has a SCSS error, the theme cache can fail to build. Check the site with a known-good theme (for example, Boost) to isolate it.
A genuinely incomplete deployment. If the deploy itself was partial (interrupted file sync, failed git checkout), files may be missing or mismatched. Confirm the working tree is clean and matches the intended release before chasing caches further.
Avoiding it on future deploys
Make a cache purge (and an opcache reset, if applicable) a standard final step of your deployment process, after the code is in place and any database upgrade has run. Treating it as part of the deploy rather than a reaction to a broken toggle means the editing UI is never serving stale JavaScript to begin with.
Search for gamification in Moodle and you will find the same promise everywhere: add points, badges, and a leaderboard, and watch bored learners turn into motivated ones. It is an appealing pitch, and it is mostly sold without evidence. The honest picture is more mixed. Gamification can genuinely help, but the exact mechanics that get sold hardest are also the ones most often linked to things going wrong. This guide lays out what the research actually supports, where it backfires, and how to approach gamification in Moodle so you get the upside without the traps.
What the evidence actually says
The research base is real, but it is not the one-sided success story vendors imply. A 2023 systematic mapping study by Almeida and colleagues found that badges, leaderboards, competitions, and points are the game design elements most often reported as causing negative effects: learners gaming the system, a novelty spike that fades, and demotivation for everyone who is not near the top. The authors concluded plainly that gamified software is “prone to generate harmful effects” (Almeida et al., 2023).
The upside is real too, but uneven, and the studies do not fully agree, which is itself telling. A 2023 meta-analysis of gamification in education (Li, Ma and Shi, 2023) found a large overall effect on learning outcomes, with motivation showing the single biggest gain. A separate 2024 meta-analysis (Li, Hew and Du, 2024) found that gamification reliably improved students’ intrinsic motivation and their sense of autonomy and relatedness, but had only a minimal effect on their competence. Put the two together and the honest reading is this: gamification is consistent at moving motivation, engagement, and belonging, and far less consistent at improving actual mastery. It can get people to show up and keep going. It does not, on its own, make them better at the subject. Both sides of that are true at once, and holding them together is the whole game.
The mechanics that backfire
Three patterns cause most of the damage, and they are exactly the default gamification toolkit.
Public competitive leaderboards. A whole-cohort ranking motivates the handful of people at the top and quietly demoralizes everyone else. The learners who most need encouragement see themselves stuck at the bottom and disengage. If you rank people publicly, you are designing for the few, not the many.
Points for everything. When you attach points to work people were already doing for their own reasons, you can crowd out that internal motivation. This is the overjustification effect, documented across decades of motivation research: once the reward is the point, take it away and the behavior can drop below where it started (Deci, Koestner and Ryan, 2001). Points also invite gaming, clicking through content to farm the score without learning anything.
Participation-trophy badges. Badges handed out for merely showing up carry no signal and quickly become noise. Learners stop noticing them, and the badges that should mean something, a real competency demonstrated, get lost in the pile.
None of this means the mechanics are useless. It means they are sharp tools that cut both ways, and bolting them on without a plan is how you get activity that looks like engagement but does not last.
Start from a behavior, not a feature
The mistake is to start with “let’s add gamification”. Start instead with a specific behavior you want more of, and be honest about whether a game mechanic actually serves it. “I want people to come back and practice regularly” is a behavior a streak or a habit nudge can genuinely support. “I want higher exam scores” is not something a leaderboard will deliver, and pretending otherwise sets you up to be disappointed. Match the mechanic to what the evidence says it can do, consistency and belonging, and stop there.
How to do it right in Moodle
Moodle gives you most of what you need without any add-on, and the native tools tend to be the well-designed ones. A practical, low-risk approach:
Use Open Badges for things that are actually earned. Moodle’s built-in badges are criteria-based: tie them to completing a real activity, passing an assessment, or demonstrating a competency, not to logging in. A badge that means something is worth far more than ten that do not.
Lean on activity completion and competencies. A clear completion trail and a visible progress bar are quietly motivating in a way that does not backfire. They show progress without ranking anyone against anyone else.
If you use a points plugin, configure against pure competition. The most widely used gamification plugin for Moodle, Level Up (block_xp), does points, levels, and leaderboards well, but the defaults lean competitive. Where the tool allows it, prefer private or team-based views over a public whole-site ranking, and treat levels as a personal progress signal rather than a race.
Make competitive elements opt-out and private by default. Let learners keep their standing to themselves. Someone who does not want to be on a leaderboard should never be forced onto one.
Do not gamify high-stakes assessment. Keep points and rewards away from the graded work that really matters, precisely because of the overjustification effect. Gamify the practice, the revisiting, the daily rhythm, and let the assessment stand on its own.
Scope it narrowly. Gamification fits courses with a genuine ongoing rhythm: language practice, compliance refreshers, skills that need regular reps. It does not belong on every course by default. Applied everywhere, it becomes wallpaper.
Measure the right thing
If you do add gamification, judge it by sustained behavior, not by vanity metrics. Points awarded and badges issued go up by definition the moment you switch the feature on; they tell you nothing. Watch whether people come back over weeks, whether completion of the target activity holds, and whether the effect survives after the novelty wears off. If the only thing that grew is the score, the gamification is working on itself, not on your learners.
The mechanic most people overlook: the streak
One mechanic lines up unusually well with what the evidence supports, and it is the one the big Moodle gamification plugins never shipped: the daily streak. Come back, keep your run alive, do not break the chain. It targets consistency and habit directly, which is exactly where gamification is strongest, rather than dangling a ranking or a reward. Done carelessly a streak can still turn into anxiety or a number people chase for its own sake, so the design matters: let learners opt out and stay private, forgive the occasional missed day with a streak freeze so one slip does not erase weeks of effort, and only apply it where a regular rhythm genuinely makes sense.
We built exactly that as a free, open-source Moodle plugin. Solin Streaks adds a per-learner streak counter, streak freezes, at-risk reminders, and a per-course leaderboard, and it renders natively in the Moodle app. It is designed around the caveats in this guide: opt-out and private by default, forgiving rather than punishing, and meant for the courses where a habit actually fits. You can install it from the Moodle Marketplace, and read the full documentation on the Solin Streaks GitHub repository.
Solin designs and builds gamification for Moodle and Totara that is grounded in what the evidence actually supports, set up and themed for you. Contact us if you want gamification done properly.
References
Almeida, C., Kalinowski, M., Uchôa, A., & Feijó, B. (2023). Negative Effects of Gamification in Education Software: Systematic Mapping and Practitioner Perceptions. Information and Software Technology, 156. arxiv.org/abs/2305.08346 (open-access preprint).
Li, M., Ma, S., & Shi, Y. (2023). Examining the effectiveness of gamification as a tool promoting teaching and learning in educational settings: a meta-analysis. Frontiers in Psychology. pmc.ncbi.nlm.nih.gov/articles/PMC10591086 (open access).
Li, L., Hew, K. F., & Du, J. (2024). Gamification enhances student intrinsic motivation, perceptions of autonomy and relatedness, but minimal impact on competency: a meta-analysis and systematic review. Educational Technology Research and Development, 72(2), 765–796. doi.org/10.1007/s11423-023-10337-7.
Deci, E. L., Koestner, R., & Ryan, R. M. (2001). Extrinsic Rewards and Intrinsic Motivation in Education: Reconsidered Once Again. Review of Educational Research, 71(1), 1–27. selfdeterminationtheory.org (PDF) (open access).
Users see a passing score in the gradebook but receive a "Failed" status that blocks completion or certificate generation. The cause is a mismatch between the decimal precision Moodle uses for display and the raw value it uses for the pass/fail comparison. This guide explains why it happens and how to fix it, with the most robust fix first and database diagnostics after.
A note on versions: the explanation and the gradebook-based fixes here apply to current and older Moodle alike. The SCORM database tables were restructured in Moodle 4.1, so this guide gives the modern table layout first and the pre-4.1 layout as a clearly-marked alternative. Plenty of production sites still run older Moodle versions, so both are worth documenting.
Why the scores diverge
Moodle stores grades with five decimal places of precision. A SCORM object that reports a score of 79.55 has exactly that value stored. The gradebook decimal setting, typically one or two places, only changes how the value is displayed. With one decimal place, 79.55 shows as 79.6; with no decimal places it shows as 80.
The problem arises when all three of these are true:
The gradebook is configured to show 0 decimal places (the score appears as 80)
The pass threshold is set to 80 (so 80.0 or higher is required)
The actual stored value is 79.55
The pass/fail check uses the stored value, not the displayed one. 79.55 >= 80.0 is false, so the user fails, while the gradebook shows 80. The user and the administrator both see what looks like a passing score. This is confirmed in Moodle core: the pass check compares the stored five-decimal finalgrade against gradepass directly, and the decimal setting is documented as affecting display only, not calculations.
This affects SCORM activities, quiz grade boundaries, and any completion condition based on a grade threshold.
Fixing it
Three approaches, in order of preference. The first two are done entirely in the Moodle interface and work on every version.
1. Align the pass threshold with the display precision. If the gradebook shows no decimal places and users expect 80% to pass, set the pass grade to 79.5 instead of 80. Any value that rounds up to 80 in the display will then also pass the comparison. In the activity (SCORM or quiz) settings:
Activity settings > Grade > Grade to pass: 79.5
This is the cleanest fix because it is per-activity, reversible, and needs no database access. Note that it does slightly lower the real pass criterion, so use it where the intent is "a displayed 80 should pass".
2. Increase gradebook decimal precision. If you show two decimal places, users and administrators see the real score (79.55) and understand why it fails. Set this under:
This is a site-wide default (it can be overridden per grade item), so evaluate the impact on all gradebooks before changing it.
3. Fix the SCORM content. If the SCORM package is under your control, adjust the calculation to return integer or properly bounded scores. A SCORM that reports cmi.core.score.raw = 80 will always pass an 80% threshold cleanly.
Confirming it from the database
If you want to verify the discrepancy directly, the gradebook tables tell the whole story and are the same across versions. Check what the gradebook holds for the activity (replace the placeholder with the activity instance id):
SELECT gg.userid, gg.rawgrade, gg.finalgrade, gi.gradepass
FROM mdl_grade_grades gg
JOIN mdl_grade_items gi ON gi.id = gg.itemid
WHERE gi.itemtype = 'mod'
  AND gi.itemmodule = 'scorm'
  AND gi.iteminstance = ?
ORDER BY gg.userid;
A finalgrade of 79.55 paired with a gradepass of 80.0 confirms the issue: the gradebook displays 80 (rounded), but 79.55 >= 80.0 fails.
For a quiz, the pass grade is not stored on the quiz record. Like all activities, it lives on the activity’s grade item, so query it the same way:
SELECT gi.iteminstance AS quizid, gi.grademax, gi.gradepass
FROM mdl_grade_items gi
WHERE gi.itemmodule = 'quiz'
  AND gi.iteminstance = ?;
To set a quiz pass grade, use the activity’s Grade > Grade to pass field rather than editing the database; Moodle writes it to the grade item for you.
Checking the raw SCORM score
To see the exact score the SCORM package reported, the query depends on your Moodle version, because the SCORM tracking tables were restructured in Moodle 4.1.
Moodle 4.1 and later (tracking split across scorm_attempt, scorm_element, and scorm_scoes_value):
SELECT a.userid, e.element, v.value
FROM mdl_scorm_scoes_value v
JOIN mdl_scorm_element e ON e.id = v.elementid
JOIN mdl_scorm_attempt a ON a.id = v.attemptid
WHERE a.scormid = ?
  AND e.element IN ('cmi.core.score.raw', 'cmi.score.raw', 'cmi.score.scaled')
ORDER BY a.userid;
Moodle 4.0 and earlier (tracking held in a single scorm_scoes_track table):
SELECT userid, element, value
FROM mdl_scorm_scoes_track
WHERE scormid = ?
  AND element IN ('cmi.core.score.raw', 'cmi.score.raw', 'cmi.score.scaled')
ORDER BY userid;
The CMI element names are the same in both: cmi.core.score.raw for SCORM 1.2, cmi.score.raw and cmi.score.scaled for SCORM 2004.
Identifying affected users in bulk
To find users whose stored grade fails but whose rounded (displayed) grade would pass, query the gradebook directly. This works the same on all versions because it uses the grade tables, not the SCORM tables:
SELECT gg.userid, gg.finalgrade, gg.rawgrade, gi.gradepass
FROM mdl_grade_grades gg
JOIN mdl_grade_items gi ON gi.id = gg.itemid
WHERE gi.iteminstance = ?
  AND gi.itemmodule = 'scorm'
  AND gg.finalgrade < gi.gradepass
  AND ROUND(gg.finalgrade, 0) >= gi.gradepass;
This returns users whose stored grade fails but whose rounded grade would pass: each is potentially affected by the mismatch. The ROUND(..., 0) here matches a gradebook set to 0 decimal places; if your gradebook shows one decimal place, use ROUND(gg.finalgrade, 1) instead so the query mirrors what users actually see.
Moodle ships with a security checklist built right into it that most admins have never opened. It is under Site administration > Reports > Security checks. Every time you load that page, Moodle runs a series of tests against your live configuration and tells you, in plain language, what is safe and what is not. Most sites have at least two or three settings wrong. This guide walks through the five that come up most often, what each one exposes, and exactly where to fix it. Paths and labels are for Moodle 4.5.
1. Displaying of PHP errors
When this is on and something breaks, Moodle prints the raw technical error straight onto the page. That error can reveal your file paths, database details, even fragments of code, to anyone who happens to trigger it: a roadmap for an attacker. On any live site this should be off. Fix it under Site administration > Development > Debugging: set Debug messages to NONE for production, and make sure Display debug messages is unticked.
2. Allow EMBED and OBJECT
Moodle’s own description calls this “very dangerous”, and it means it. With <embed> and <object> tags allowed, any user who can add content can paste in markup that runs code inside other people’s browsers, a cross-site scripting attack. Unless you have a very specific reason and you trust every single account on your site, leave this off. (This is the same RISK_XSS family that the “XSS trusted users” check counts.)
3. Open to search engines
This setting lets Google and other crawlers walk into your courses as a guest. On its own that might be harmless, but combined with guest access switched on, it can quietly publish course content you assumed was private to the entire internet. If you do not specifically need public, crawlable courses, turn it off. The security report links straight to the setting.
4. Default role for all users, and Site home role
This is the subtle one. The security report has two related checks, “Default role for all users” and “Site home role”. Every logged-in person on your site inherits the capabilities of these roles. So if a risky capability ever creeps in here, you have not handed it to one user, you have handed it to everyone with an account. Open each of these roles (under Define roles) and confirm nothing dangerous is allowed; they should be kept to the bare minimum.
5. Secure cookies
If your site runs on HTTPS, and it absolutely should, the Secure cookies setting tells the browser never to send the session cookie over an unencrypted connection. That closes a real session-hijacking gap. Turn it on once your site is fully HTTPS. (Enabling it on a site still partly served over HTTP can lock users out, so make the HTTPS move first, then set this.)
Make this a habit
These five are the common offenders, but the Security checks report covers more: writable config, the guest role, password policy, antivirus, and others. It re-runs every time you open it, so make a habit of checking it after any upgrade or configuration change. A couple of minutes on this page leaves your site meaningfully harder to attack.
Solin hardens and audits Moodle installations for organizations that take security seriously. Contact us for a security review.
Someone has told you to make your Moodle “GDPR compliant”, and most of what you find online is legal theory. This guide skips that and gives the concrete list of things you, as the administrator, actually set up and operate inside Moodle. There are five, and Moodle has a dedicated tool for each. Everything below lives under Site administration > Users > Privacy and policies, powered by two core tools, tool_dataprivacy and tool_policy. Paths and behavior are for Moodle 4.5. None of this is legal advice; it is the operational checklist that sits underneath whatever your DPO decides.
Prefer to watch? Here is a short walkthrough of the Moodle GDPR compliance setup:
1. Decide who is responsible: a Privacy Officer role
First, decide who handles data requests, because GDPR gives you a fixed deadline to respond and someone has to own that clock. Create a Privacy Officer role (base it on the Manager archetype) and grant it the data privacy capabilities your process needs, in particular tool/dataprivacy:managedatarequests and tool/dataprivacy:managedataregistry, plus the download and make-requests-for-children capabilities if you use them. Then assign it to a real person at site level. The step that is easy to miss: tick that role under Data privacy settings > Privacy officer so the holders are actually emailed when a request arrives, and turn on Contact the privacy officer. That second toggle does more than add a contact link: it is what makes the Export all of my personal data and Delete my account options appear on each user’s profile, under Privacy and policies. Leave it off (which is the default) and your users have no way to file their own request; only an admin or privacy officer can raise one on their behalf from the Data requests page. Sensible default: enable it, and name one privacy officer plus one backup so requests do not stall when someone is on leave. Skip all of this and a site admin can still process requests (Moodle does not lock you out), but with no named owner they are more likely to be missed or handled late, which is itself a compliance risk.
2. Declare why and how long: the data registry
The Data registry (/admin/tool/dataprivacy/dataregistry.php) is where you record, in Moodle’s own terms, what personal data you hold, why you are allowed to hold it, and how long you keep it. This is the documentation auditors and data protection officers ask for, and it also drives Moodle’s retention handling. It is built from two pieces: categories, which label a type of data, and purposes, which state the reason you process it and its retention period. You set a default category and purpose for the whole site and can override them lower down, per course category, course, activity, or block.
The real decisions live in the purpose. When you create one, you fill in:
Lawful basis (GDPR Art. 6): why you are legally allowed to process the data. For workplace training this is usually Legal obligation (you must be able to evidence mandatory training) or Contract (training forms part of employment). A public body might use Public task; genuinely optional data, such as a marketing preference, uses Consent.
Retention period: how long you keep the data. When it expires, Moodle flags the data and lists it for deletion for an administrator to confirm, so nothing is destroyed silently. For a user, the period is counted from the last time they accessed the site.
Protected: tick this for data you are legally required to keep, so a right-to-be-forgotten request cannot remove it before the retention period ends.
Sensitive data reasons (GDPR Art. 9): only needed if you hold special-category data such as health information.
If you are not sure where to start, a sensible default for a typical workplace-training site is one category, Learner records, and one site-wide purpose, Training records, with lawful basis Legal obligation and a retention period that matches how long you must be able to prove compliance (for example, three years since the learner’s last access). Mark certification or mandatory-training evidence as Protected so it survives an erasure request until that period is up. Then make that category and purpose the site-wide default: on the Data registry page the tree’s top node, Site, is selected for you, so choose your category and purpose there and click Save changes, making sure both selectors show an actual value and not Not set before you save. Do this on the Site node itself, not via the separate Set defaults button: that button only covers course categories, courses, activities, and blocks, so it never sets the site-level default. This matters before you handle any requests. Until a site default purpose is set, the Data requests page shows a red “A site purpose and category have not been defined” warning, and an erasure request would remove all of a user’s data instead of expiring only what is past its retention period. Retention itself is enforced on the separate Data deletion page (/admin/tool/dataprivacy/datadeletion.php), which lists contexts that are past their retention period and waits for your confirmation before the “Delete expired contexts” scheduled task removes the data.
3. Operate the data request queue (the part GDPR requires)
This is the heart of it. Under Data requests (/admin/tool/dataprivacy/datarequests.php) you will find the queue. A user clicks “Data request” in their profile to either export their personal data or have it deleted, and it lands here for your Privacy Officer to action.
Export request: approve it, and Moodle assembles a downloadable archive of the personal data it can reach through its privacy system. How complete that archive is depends on plugin privacy support, which is point 4. This is your right-of-access answer.
Erasure (delete) request: approve it, and Moodle runs its deletion workflow for that user’s personal data, within the limits of core and plugin privacy support. The right to erasure is not absolute, so your DPO still decides whether a given request should be granted. This is your right-to-be-forgotten answer.
Both are built in; your job is to make sure someone owns the queue and works it within the legal time limit, which under GDPR is one month. Sensible defaults: leave automatic approval off, at least for deletions, so a human reviews each erasure before any data is destroyed, and set a Data request expiry so completed export downloads do not stay available indefinitely.
4. The trap almost everyone misses: the plugin privacy registry
The Plugin privacy registry (/admin/tool/dataprivacy/pluginregistry.php) lists every plugin on your site and whether it properly implements Moodle’s Privacy API. Here is the catch: if a non-compliant plugin stores personal data, that data is not included when you export someone’s data, and it is not removed when you process an erasure request. Personal data can therefore survive quietly inside that plugin, and you would never know it from the request itself. There is nothing to fill in here; it is a review, and one you should repeat after every plugin install or upgrade. Sensible default: treat “does not implement the Privacy API” as a blocker for any plugin that stores personal data, and prefer an alternative that does, because a non-compliant plugin quietly undermines both of the rights in point 3.
5. Publish policies and record consent
Finally, publish your policies and capture consent. One setting makes or breaks this: under Policy settings, set the Site policy handler to Policies (tool_policy). Until you do, the tool stores nothing and no consent is enforced, which is the usual reason “I created a policy but nobody is asked to accept it.” Then, under Policies (/admin/tool/policy/managedocs.php), create each document with a name, a type (Site policy, Privacy policy, Third parties, or Other), a short summary, the full text, and an audience (usually All users). Set the status to Active and users must consent at their next login, with each acceptance recorded against a policy version and timestamp as your evidence. Sensible default: publish at least a Privacy policy and a Site policy aimed at All users; later, when you edit one, mark trivial wording fixes as a Minor change so you do not force everyone to re-consent unnecessarily. One caution: Moodle’s recorded policy acceptance is not the same thing as GDPR consent as a lawful basis. Plenty of processing relies on contract, legal obligation, or legitimate interests instead, so your DPO still decides the lawful basis for each purpose (point 2).
Recap
An owner, retention defined in the data registry, the request queue, the plugin privacy check, and policies with tracked consent. Keep these five operational and you have covered the main Moodle-side admin workflows that support GDPR compliance. The lawful basis for each purpose, your retention policy, processor agreements, external systems, backups, and the final decision on each request remain your DPO’s responsibility.
What this does not cover
This checklist covers Moodle’s built-in operational tools only. It does not replace a GDPR review of your lawful bases, your privacy notice, processor agreements, your hosting setup and backups, or any external plugins, LTI tools, analytics, video platforms, or custom integrations that handle personal data outside these screens. Setting up these five areas is the Moodle-side groundwork; it is not, on its own, a statement that your site is GDPR compliant.
Solin helps organizations in regulated sectors operate Moodle and Totara in a GDPR-aligned way, including privacy API gaps in third-party plugins. Contact us for a review.
A learner finishes a SCORM module and the player shows it as completed, yet Moodle leaves the activity (and therefore the course) incomplete, blocking certificates and compliance reporting. The cause is almost always a mismatch between the runtime status the SCORM package reports and the status the activity’s completion condition requires, compounded by the fact that course completion is recalculated on a schedule, not instantly. This guide explains the three layers of “complete” in Moodle, how to see what your package actually reported, and how to fix the mismatch. Paths and SQL are for Moodle 4.5.
Prefer to watch? Here is a short walkthrough of the completion mismatch and how to fix it:
The three layers of “complete”
The word “complete” means three different things at three different layers, and a learner is only finished when all three agree:
The SCORM runtime status – what the package itself reports back to Moodle (for example cmi.core.lesson_status = completed).
Activity completion – Moodle’s own decision about whether the SCORM activity is complete, based on the conditions you configured on that activity.
Course completion – whether the course is complete, based on the activities and criteria you nominated, recalculated by a scheduled task.
A breakdown at any layer stops the chain. The most common failure is between layers 1 and 2.
Layer 1: what the SCORM package reports
SCORM 1.2 and AICC report a single field, cmi.core.lesson_status, which can be passed, completed, failed, incomplete, browsed, or not attempted.
SCORM 2004 splits this into two separate fields: cmi.completion_status (completed / incomplete) and cmi.success_status (passed / failed). This split matters: in Moodle, for a SCORM 2004 package the only status treated as complete is cmi.completion_status = completed. A package that reports success_status = passed but leaves completion_status at incomplete will never satisfy a completion-status condition.
The quickest way to see exactly what your package reported is in the interface: open the SCORM activity, go to Reports, click the learner’s attempt, and open Track details. The reported status is shown there. If you would rather query it directly, the tracking tables in Moodle 4.5 are:
SELECT a.userid, e.element, v.value
FROM mdl_scorm_scoes_value v
JOIN mdl_scorm_attempt a ON a.id = v.attemptid
JOIN mdl_scorm_element e ON e.id = v.elementid
WHERE a.scormid = ?
  AND e.element IN ('cmi.core.lesson_status', 'cmi.completion_status', 'cmi.success_status')
ORDER BY a.userid;
(These tables were restructured in Moodle 4.x; on 4.0 and earlier the equivalent data lived in a single mdl_scorm_scoes_track table.)
Layer 2: the SCORM activity’s completion conditions
A SCORM activity offers three completion conditions in the Activity completion section of its settings:
Require status – a set of checkboxes (Passed, Completed, Failed, Incomplete, Browsed, Not attempted). The activity is marked complete when the reported status matches at least one of the ticked statuses.
Require minimum score – the activity is complete only when the SCORM score reaches the value you set.
All SCOs must return completion status – every SCO in a multi-SCO package must report a status, not just the launch SCO.
This is where the mismatch lives. If your package reports completed but Require status has only Passed ticked, the condition is never met and the activity never completes, even though the player clearly showed “completed”. The reverse is equally common: a package reports passed, but only Completed is ticked.
You can confirm the resulting activity-completion state per learner:
SELECT cmc.userid, cmc.completionstate
FROM mdl_course_modules_completion cmc
JOIN mdl_course_modules cm ON cm.id = cmc.coursemoduleid
WHERE cm.instance = ?  -- the SCORM instance id
  AND cm.module = (SELECT id FROM mdl_modules WHERE name = 'scorm');
completionstate is 0 (incomplete), 1 (complete), 2 (complete with pass), or 3 (complete with fail).
Layer 3: course completion and the recalculation lag
Course completion is configured under Course > More > Course completion. To make the SCORM activity count, add it under Condition: Activity completion and check whether the overall condition requires all selected activities or any of them.
Two things commonly trip people here:
The SCORM activity is complete, but it was never added as a course-completion criterion, so the course can never complete on the back of it.
The activity is complete, but the course still shows incomplete for a while. Course completion is not recalculated the instant an activity completes; it is processed by the scheduled task \core\task\completion_regular_task. Until the next run (or the learner reloads the course), the course status lags behind the activity status.
You can see which activities the course depends on:
SELECT course, criteriatype, moduleinstance
FROM mdl_course_completion_criteria
WHERE course = ?;
A criteriatype of 4 is an activity-completion criterion; moduleinstance is the course-module id of the activity.
Fixing it
Match the required status to what the package reports. Open the SCORM activity, go to Activity completion, and under Require status tick the status your package actually sends (confirmed in Track details or the query above). If you are unsure what it sends, tick both Passed and Completed; the learner only needs to satisfy one of them.
For SCORM 2004 packages, ensure the package sets cmi.completion_status = completed. If it only sets success_status, the completion-status condition will not be met; either fix the package or base completion on the minimum score instead.
Check the “All SCOs” condition. If the package has multiple SCOs (for example a menu plus content SCOs) and one never reports a status, untick All SCOs must return completion status or fix the package so every SCO reports one.
Add the activity to course completion and confirm the any/all aggregation matches your intent.
Allow for the recalculation lag, or trigger it. After fixing the conditions, course completion updates on the next cron run. To verify immediately, run cron (php admin/cli/cron.php) or have the learner reload the course.
Re-checking existing learners
Changing a completion condition does not always retro-apply cleanly to learners who already attempted the activity. After adjusting the condition, use Reports > Activity completion and Course completion to confirm the affected learners now show complete, and run cron so course completion catches up. For a learner whose attempt predates the fix, a fresh review of completion (or, in stubborn cases, re-marking the attempt) may be needed.
Related
If your problem is a numeric pass/fail rather than a status mismatch (a learner sees a passing score on screen but Moodle records a fail), that is a different failure mode caused by grade rounding. See our guide on SCORM and quiz grade rounding for that case.
Solin specializes in Moodle and Totara completion, SCORM, and certification workflows. Contact us if a completion problem is blocking your reporting.
An auditor asks you to prove that everyone completed their mandatory training. Not “we delivered it”, but proof, per person, that stands up when they pull a sample at random. The good news is that Moodle already holds everything you need; the skill is knowing which report to pull, and in what form an auditor will actually accept it. This guide covers the four evidence sources and what makes each one defensible. Paths and behavior are for Moodle 4.5.
Prefer to watch? Here is a short walkthrough of pulling audit-ready completion evidence:
What “audit-ready” means
Before pulling anything, it helps to know the bar. Evidence that auditors accept is:
Dated – undated records are the single most common thing auditors reject.
Granular – down to the individual person and what they did.
Exportable – they will want a copy, not a screen.
Inclusive – it covers everyone in scope, including contractors and temporary staff, not just permanent employees.
Each source below contributes to that picture.
1. The course completion report (your primary evidence)
Start with Reports > Course completion. For every learner it shows whether they met the requirements and, crucially, when. Use the Download in spreadsheet format option at the foot of the report to export who completed what and on which date. That export is your primary evidence pack. (If completion tracking was never switched on for the course, this report is empty; set that up first, because retro-dating completions is not something an auditor will accept.)
2. Activity logs (corroboration for a sample)
Auditors sample, so be ready to back any single record up. The Logs report (Reports > Logs) gives dated, per-user activity: when each person accessed the material and when they submitted. Filter it to the course and to the specific people in the auditor’s sample, and you have corroboration for the completion record straight from the system’s own audit trail.
One caveat worth stating up front: Moodle’s standard logs are subject to a retention period set under Site administration > Plugins > Logging > Standard log, the “Keep logs for” setting. If your audit window is longer than that retention, either extend the retention before the period elapses or export logs periodically. Do not assume two-year-old logs are still there.
3. Grade export (proof of the assessment result)
If the training carries an assessment, export the grades too: Grades > Export > Excel spreadsheet. Now your evidence pack also shows the score each person achieved and that they passed, dated alongside the completion record. This matters where “attended” is not enough and the standard requires a demonstrated pass mark.
4. Verifiable certificates (the strongest single artifact)
The most defensible single artifact is a certificate the auditor can verify independently. Moodle core does not ship a certificate activity, but the widely used Custom certificate plugin (mod_customcert) does, and it issues certificates with a verification code. The certificate records the learner’s name, the course, and the date; the auditor goes to the certificate verification page, types in the code, and Moodle itself confirms the certificate is genuine and who it belongs to. That is about as defensible as evidence gets, because it does not rely on your word.
If you do not have a certificate plugin installed, the completion report plus logs and grades is still a complete evidence pack; the certificate is the icing, not the cake.
Putting the pack together
For a typical audit response: export the course completion report as your headline evidence, keep the grade export alongside it if there is an assessment, and be ready to produce filtered logs and a verified certificate for any name the auditor samples. Make sure the scope of the export includes contractors and temporary accounts. Dated, granular, exportable, inclusive: Moodle holds all of it, you just need to know where to look.
Solin helps regulated organizations build audit-ready evidence workflows in Moodle and Totara, including ISO 27001 and sector compliance. Contact us to talk it through.
Every plugin you add to Moodle is code written by someone outside the Moodle project, and someone has to keep updating it for each new Moodle version. When they stop, that plugin quietly becomes your problem: it can break on your next upgrade, and worse, it stops receiving security fixes. Here is how to check your whole site in about two minutes, and how to judge whether a plugin is genuinely abandoned or just stable. Paths and behavior are for Moodle 4.5.
Step 1: find your third-party plugins
Go to Site administration > Plugins > Plugins overview (/admin/plugins.php). This lists every plugin installed, grouped by type. The ones that are not part of the standard Moodle distribution are your third-party additions (the overview groups these as Additional plugins); those are the ones whose maintenance is not the Moodle project’s responsibility.
Step 2: read the update signals
If a plugin is flagged under Available updates, that is actually good news: it means the plugin is still being looked after, so you simply update it. Use the Check for available updates button to refresh that list. The ones to pay attention to are the additional plugins with no update available and a version that has not moved in a long time. The version string and release date shown here are your first clue, but they are not the whole story; for that, go to the source.
Step 3: check the plugin in the Moodle directory
The authoritative “is it abandoned” signal is the plugin’s page in the Moodle plugins directory at moodle.org/plugins. Open it and look at three things:
The date of the latest release. Years since the last release is a warning sign.
The supported Moodle versions. Does it even list your version? A plugin that does not claim support for your Moodle is running on borrowed time.
How many sites still use it. Usage trailing off, combined with the above, points to abandonment.
A plugin whose last release was years ago, that does not support your Moodle version, with usage falling away, is effectively abandoned, even if it still happens to run today.
Step 4: decide what to do
Once you have found an abandoned plugin you have three choices:
Update it if a newer version exists (the easy case).
Replace it with a maintained alternative that covers the same need.
Remove it entirely if you no longer rely on it.
The one thing you should not do is leave abandoned, unpatched code running on a site that holds real people’s data. Before removing or replacing a plugin that stores data, check what happens to that data (and whether it implements the Privacy API) so you do not strand personal information or break existing courses. Do this check before every major Moodle upgrade, not just when something breaks; an unsupported plugin is the most common reason an upgrade stalls.
Solin manages Moodle and Totara plugin estates, upgrades, and third-party code audits. Contact us if you would like a plugin health check.