You opened Site administration > Reports > Security overview, and one row is sitting on a yellow Warning: “XSS trusted users”, with a number next to it. It reads like an alarm. It is not. Nobody has been hacked, and nothing is broken.
That row is a trust roster. It tells you how many people on your site hold a permission powerful enough that, in the wrong hands, it could be misused. Your job is not to make the number zero. Your job is to look at the list and confirm that everyone on it is someone you actually trust. This guide walks through exactly how to read that warning and act on it, step by step, using only the Moodle admin screens. No database queries, no command line. Paths and behavior are for Moodle 4.5.
Prefer to watch? Here is a short walkthrough of reading and acting on the dangerous capabilities warning:
What the warning actually means
Every permission in Moodle (every capability) can carry one or more risk flags. They are advisory labels, not faults. There are six:
XSS – the user can submit content that Moodle does not clean, such as HTML with active scripting or unchecked files. This is the one the “XSS trusted users” check counts.
Configuration – the user can change site-wide settings.
Personal – the user can reach other people’s private data.
Spam – the user can put content in front of others, or message them.
Data loss – the user can destroy large amounts of data that is hard to recover.
Manage trust – the user can manage other users’ trust settings.
A capability flagged XSS is not a vulnerability. It is simply powerful: anyone who can author rich content (paste HTML, embed media, restore a course, manage roles) can in principle insert a script. That is normal and necessary. The point of the flag is so you can reason about who holds that power.
The most useful fact to keep in mind is how Moodle assigns these risks by default:
Guest holds capabilities with no risk at all.
Student adds Spam.
Teacher adds Personal and XSS.
Manager and Administrator effectively hold everything.
So your administrators, managers, and teachers are supposed to be on the XSS list. A non-empty list is the correct, healthy state. The warning is really one question: is everyone here someone I trust to post rich content?
Step 1: Read the list
Go to Site administration > Reports > Security overview and click XSS trusted users (or More info on that row).
Moodle now shows you every user who holds an XSS-flagged capability, anywhere on the site, each name linked to their profile. The page states the task plainly: verify the list and make sure you trust these people completely. Read the names. This is the audit.
Step 2: Decide who belongs
For each person, ask one question: should this account be able to author rich content, manage roles, or restore courses?
Expected, leave them alone: administrators, managers, teachers, course creators, and any content-author role you deliberately created.
Investigate: an account that should never author content (a plain learner, a generic “info” or service account), an unfamiliar name, or anything that looks automated or left over.
There is also a list-length signal. If the roster is dramatically longer than the number of staff who should have content power, a risky capability has almost certainly leaked into a role that is handed to many people at once, or a staff role has been assigned far too broadly. Hold that thought for Step 5.
Step 3: Find out why a user is on the list
This is the step most write-ups skip, because Moodle has no single screen that says “this user is risky because of capability X in role Y.” You assemble it from two screens, and it takes about thirty seconds per person.
From the list in Step 1, click the user’s name to open their profile, then go to Preferences > This user’s role assignments (under the Roles heading).
This page shows every role the user holds and the exact context for each one: system, a category, or a single course. It is where the cause usually jumps out, for example a support-style or helpdesk-style role assigned at system level, a Teacher or Manager role assigned site-wide instead of inside one course, or a custom role that grants far more than its name suggests.
A teacher assigned inside one course is exactly where they should be. A “support” role sitting at the top, system level, is the kind of thing this audit exists to catch.
Step 4: Confirm which capability is responsible
Open the role you just identified: Site administration > Users > Permissions > Define roles, then open that role.
On the capability table, the Risks column on the right shows a small icon against every capability that carries a risk. Hover an icon to see its label; the one marked XSS risk is your confirmation that this is what put the user on the list. Reading down that column tells you, at a glance, how much power the role really grants, which is often far more than its name implies.
If you would rather work the other way around, Site administration > Reports > Capability overview lets you pick a specific capability and see which roles grant it across the whole site. That is the fastest way to answer “which roles hand out this exact permission?”
Step 5: Fix it the right way
You have three clean options. Choose by what is actually wrong, and follow the principle of least privilege: give each person the least power that lets them do their job.
The person should not have that power. Remove them from the role, or narrow the assignment to the correct context. You can do this from the user’s role-assignments page or under the role’s Assign roles tab.
The role should not grant that capability. Edit the role (Define roles > [role] > Edit) and set the offending capability to Not set or Prevent, then save. This affects everyone who holds that role, so make sure none of them need it.
The capability is on a role given to everyone. This is the most common cause of a bloated list, and the most urgent. Check the Authenticated user, Guest, and Front page roles first: a single risky capability there is handed to your entire user base at once. These roles should never carry a dangerous capability.
One thing not to do: do not strip XSS capabilities from your standard Teacher role just to clear the warning. Teachers are on the list by design, and removing those capabilities breaks legitimate content authoring. If a particular teacher should be more limited, narrow where they are assigned rather than rewriting the shipped role. Editing default roles globally also wipes any course-level overrides your teachers rely on, so prefer a context-specific override or a purpose-built custom role.
Step 6: Verify, then re-check
Confirm the change did what you intended before you move on. In the relevant context (a course’s Participants > Permissions > Check permissions, or the system-level Check permissions screen), look up the user and confirm they can, or can no longer, do the thing you changed. This shows you the computed result rather than your assumption of it.
Then re-run Reports > Security overview. The XSS trusted users count should now contain only people you trust. Again: the target is not zero. The target is no surprises.
A note on “trusted content”
If you want to understand why XSS is a risk category at all, it comes down to how Moodle cleans HTML. By default Moodle strips active content from what users submit. There is an optional setting, Enable trusted content (under Site administration > Security), that, together with the moodle/site:trustcontent capability, lets named users save HTML that bypasses that cleaning.
It is off by default, and that is the right default for almost everyone. Leave it off unless you have a concrete reason to turn it on, and if you do, grant moodle/site:trustcontent to the smallest, most trusted group possible, because it widens exactly the list you just audited. For extra hardening in the other direction, the $CFG->forceclean setting forces content cleaning everywhere.
The same habit covers the whole report
The XSS trusted users check is one of several access checks in the Security overview, alongside Administrators, Guest role, Default user role, Front page role, and Backup data access risk. They all answer the same kind of question: are these settings, and these people, what I expect? Treat the security report as a periodic review rather than a one-time cleanup, and run through it after any change to roles or permissions.
Tick off the people who should be there (admins, managers, teachers, content authors).
For anyone who looks wrong: Profile > Preferences > This user’s role assignments to find the role and context.
Define roles > [role]: read the Risks column to confirm the capability, or use the Capability overview report.
Fix by least privilege: unassign the person, narrow the context, or prevent the capability. Check blanket roles (Authenticated user, Guest, Front page) first.
Check permissions to verify, then re-run the Security overview. Aim for “only trusted people”, not zero.
Solin specializes in Moodle role and permission security. Contact us for a roles and capabilities audit.
The hard question in mandatory training is not “did we run it”, it is “who has not done it yet”. Too often the honest answer lives in a spreadsheet that somebody updates by hand and that is out of date the moment it is saved. Moodle can answer that question on demand if you wire up four things: a group that defines who is in scope, automatic enrollment for that group, a clear definition of what “complete” means, and the report that reads it back. This guide walks through all four on Moodle 4.5. The approach is the same for compliance, health and safety, and onboarding training.
Prefer to watch? Here is a short walkthrough of tracking mandatory training completion:
Step 1: define who is in scope with a cohort
Start with the people who have to do the training. In Moodle this is a cohort: a named group of users such as All Staff, New Starters, or a particular department or site. Create it under Site administration > Users > Cohorts, then use the Assign action (the people icon) to add members. You can also bulk-load membership by uploading users with a cohort1 column, or via Upload cohorts for the groups themselves.
The point of building the group once, in one place, is that it becomes your single source of truth for who is in scope. Every course that uses it inherits the same membership, and you maintain that membership in exactly one location.
Step 2: connect the cohort to the course with Cohort sync
Now enroll that group into the mandatory course automatically. In the course, open Participants > Enrolment methods, add Cohort sync, point it at your cohort, and assign the Student role. The enrol_cohort plugin is part of Moodle core, so nothing needs installing.
Two things make this better than manual enrollment:
Everyone in the cohort is enrolled at once, with no chance of missing someone.
When someone is added to the cohort later, a new hire for example, they are enrolled in the mandatory training automatically, without anyone touching the course.
By default, removing a user from the cohort unenrolls them from the course (their grades are hidden, not deleted). You can change this to “Suspend” in the cohort sync method’s settings if you would rather keep the records visible while revoking access.
Step 3: tell Moodle what “complete” actually means
This is the step people skip, and without it “completion” is just a guess. First, make sure Enable completion tracking is set to Yes in the course settings. Then open Course > More > Course completion and define the condition. For most mandatory training the right condition is Activity completion of the required activity (the policy page, the SCORM module, the quiz, and so on), with the aggregation set to require all selected activities.
For this to work, the activity itself must also have completion configured, under its Activity completion section, so that Moodle knows when that activity is done (viewed, submitted, passed, and so on). With both in place, completion becomes a real, tracked status you can report on and stand behind, rather than a manual tick.
Step 4: read the Course completion report
This is the payoff. Open Reports > Course completion (/report/completion/index.php?course=ID). You get a grid of every person in scope and exactly where they stand: who has met the requirements and who has not. The incomplete rows are your follow-up list, accurate and live rather than a stale spreadsheet.
Export it straight to a spreadsheet (CSV or Excel) for your records, using the download options at the bottom of the report.
Break it down by group with the group selector, so each manager sees only their own team. Set up Moodle groups in the course if you want this per-team view.
A note on recurring (annual) training
One honest limitation: standard Moodle course completion does not reset itself on a schedule. If your compliance training has to be repeated every year, a one-off completion will stay “complete” indefinitely. For genuinely recurring requirements you have a few options: reset completion for the cohort at the start of each cycle, run a fresh course per cycle, or move to Totara, whose certification feature is built around recurring recertification windows. Choose the approach before you launch, because retrofitting it across historical records is more work.
Recap
Define the group, sync it into the course, define what “done” means, and read the report. That is mandatory training tracking that maintains itself. Whatever platform you are on, insist on these four things; in Moodle they are all built in.
Solin specializes in Moodle and Totara compliance tracking, completion, and reporting. Contact us if you would like help setting this up.
A Moodle site runs out of disk and the culprit is moodledata: the trash directory, automated backup files, or the recycle bin has grown unchecked. It is tempting to blame “trashdir not emptying,” but on a current Moodle the real causes are usually elsewhere. This guide explains what actually consumes the space and the settings that control each one.
What trashdir actually is
moodledata/trashdir is the trash for Moodle’s file storage pool (filedir), not for backups. When a stored file is dereferenced (no activity points at its content any more), Moodle moves the underlying content file into trashdir. A scheduled task, \core\task\file_trash_cleanup_task, empties it. In Moodle 4.5 that task runs every six hours.
So if trashdir is large, the question is whether that cleanup task is running. Check it under Site administration > Server > Tasks > Scheduled tasks (look for the file trash cleanup task) and review Task logs for failures. If cron itself is not running, this task is not running either, and trashdir grows. Confirm cron is alive:
sudo -u www-data php admin/cli/cron.php
A correctly functioning site empties trashdir on schedule. If yours is not, the problem is cron or that specific task, not a missing setting.
What automated backups do (and the safeguard you may not know about)
A common assumption is that a misconfigured or unreachable backup destination causes files to pile up in moodledata until the disk fills. On Moodle 4.5 the opposite is true: there is an explicit safeguard against exactly that. When the automated backup task cannot use the configured external destination (it is missing, not a directory, or not writable), Moodle logs an error, skips the copy, and deletes the backup file rather than leaving it behind. The code comment states the intent directly: it is there to prevent moodledata from filling up when the destination is misconfigured.
That means a broken destination gives you failed backups and error logs, not a slow disk-fill. If moodledata is genuinely filling from backups, look at the settings that govern retention instead.
The settings that actually control backup disk use
Under Site administration > Courses > Backups > Automated backup setup:
Automated backup storage (backup_auto_storage) decides where automated backups are kept: in course backup areas (inside moodledata), in a specified external directory, or both. If this is set to keep them inside moodledata, that is where your space is going.
Maximum number of backups kept (backup_auto_max_kept) caps how many backups are retained per course. If this is high (or effectively unlimited) and you back up frequently, old backups accumulate. Lowering it lets Moodle prune the surplus.
Delete backups older than (backup_auto_delete_days) prunes by age. Combined with max-kept, these two settings are the real levers for backup disk consumption.
Set these to match your actual retention policy. Most sites do not need to keep every automated backup forever inside moodledata.
The recycle bin: the other quiet consumer
Moodle’s recycle bin (the tool_recyclebin admin tool) retains deleted courses and deleted activities so they can be restored. Those retained items live in moodledata and can be substantial, a deleted course holds its entire backup. Two scheduled tasks (cleanup_course_bin and cleanup_category_bin) purge expired items, governed by the expiry settings:
tool_recyclebin / coursebinexpiry and categorybinexpiry set how long deleted items are kept before automatic purging.
If these expiry periods are long (or set to never expire) and people delete and re-create courses regularly, the recycle bin can quietly become one of the largest consumers of moodledata. Check its retention settings under Site administration > Plugins > Admin tools > Recycle bin.
Diagnosing where the space has actually gone
Before changing settings, measure. From the moodledata directory:
du -sh trashdir filedir backup
du -sh * | sort -rh | head -20
This tells you whether the space is in trashdir (cleanup task issue), filedir (real content, or dereferenced content awaiting trash), backup areas (retention settings), or elsewhere. Treat the largest directory first rather than assuming it is trashdir.
Clearing trashdir manually, safely
If trashdir has grown and you need space back immediately while you fix the underlying cron/task issue, it can be emptied by hand, because by definition it only holds dereferenced content-pool files:
find moodledata/trashdir -type f -delete
This is what the cleanup task does anyway. Using find rather than rm -rf moodledata/trashdir/* avoids argument-list limits on directories with very many files, and leaves the directory itself in place. It does not touch live files, backups, or the recycle bin. Still, take the usual care: confirm the path, and make sure you are operating on trashdir and not filedir.
The short version
trashdir is emptied by a scheduled task every six hours; if it is full, fix cron, not a setting. A broken backup destination does not fill moodledata on 4.5 (there is a safeguard). The real backup disk levers are the storage location, max-kept, and delete-after-days settings. And do not overlook the recycle bin, which retains deleted courses in moodledata until its expiry settings purge them. Measure with du before acting.
Uploading a large zip file to Moodle succeeds, but extracting it (for example in Private files, or any file manager that offers “Unzip”) fails with a generic error. The reason is that Moodle keeps the original archive in the file area while unpacking, so extraction needs room for the zip plus its uncompressed contents at once, and that combined size is checked against the file area’s size limit, not against the per-file upload limit that let the zip in.
Two different limits, and why that matters
There are two distinct kinds of limit, and the unzip failure is about
the second one:
The per-file upload limit caps the size of a single
uploaded file. It is the minimum of PHP's upload_max_filesize
and post_max_size, the site limit ($CFG->maxbytes),
and the course/activity limit. This governs getting the zip in,
and it is usually not the problem here.
The file-area size limit (areamaxbytes)
caps the total size of everything in a given file area at once. For
Private files this comes from $CFG->userquota.
This is the limit the unzip operation actually checks.
The trap is that these are different numbers. A zip can be small enough
to upload, then fail to extract because the zip plus its contents exceed
the area limit. Note that a plain File resource
does not impose an area limit at all, so the failure typically shows up in
Private files or other quota-bound areas rather than when adding a File
resource to a course.
Why the math catches you out
Consider a 600 MB zip file containing a large SCORM package or video
collection. The actual uncompressed size is also approximately 600 MB.
During extraction:
The zip file remains on disk: 600 MB
The extracted files are written alongside it: 600
MB
Peak combined usage: ~1.2 GB
If the area limit is 1 GB, extraction fails. The upload succeeded
because 600 MB is under 1 GB. The extraction fails because the zip plus
its extracted contents, ~1.2 GB in the area at once, is not.
The error message Moodle shows, something like “Cannot unzip file”, does not explain this. It looks identical to a corrupt zip or a
permissions error.
Finding which limit is
triggering
If the failure is in Private files (the most common case), the area
limit is the user quota. Check it at:
Site administration > Security > Site security settings > User quota
The user quota ($CFG->userquota) is the total a user may
hold in their private files area. The zip plus its extracted contents
must fit under it simultaneously, which is the ~2x requirement. Users
with the moodle/user:ignoreuserquota capability are exempt,
which is why an administrator may not reproduce a learner's failure.
Confirm the zip did clear the separate per-file upload limit (it almost
always did, since it uploaded). The effective upload limit is the minimum
of the PHP, site, and course values; cross-reference PHP with:
Raise the area limit so the zip and its contents fit at once. For a
Private files failure, that means temporarily increasing the user quota
to at least twice the zip size:
Site administration > Security > Site security settings > User quota
Extract the zip, then return the quota to its normal value. Because the
user quota is site-wide, do not leave it inflated permanently. An
alternative that avoids changing the quota at all is to grant the affected
user the moodle/user:ignoreuserquota capability for the
extraction, then remove it.
Avoiding the problem
Do not try to “extract on the server” by unzipping into moodledata
directly. Moodle stores file content by SHA1 content hash with matching
rows in the mdl_files table, so loose files dropped into the
filesystem are not recognised, and there is no CLI tool to register them
after the fact. Work through Moodle's own file handling instead.
The cleaner long-term fix is to avoid pushing very large archives
through a quota-bound area at all. For SCORM packages specifically, many
authoring tools can produce smaller packages by splitting large assets
(video) out of the SCORM zip and referencing them as external resources,
which keeps both the upload and the extracted footprint well under the
limits.
Moodle already contains useful data about student engagement: course access, activity completion, grades, and discussion activity. The difficulty is that this data is often scattered across reports, or surfaced through analytics tools that teachers may not fully trust because the reasoning behind a warning is not always obvious.
To solve this, we built Solin Early Warning. It is a Moodle block (a small panel that appears on the side of a course page) that pulls relevant signals into a ranked list directly inside the course. Instead of pushing opaque alerts or automated emails, it uses a multi-signal architecture to tell you exactly why a student was flagged, right where you need to see it.
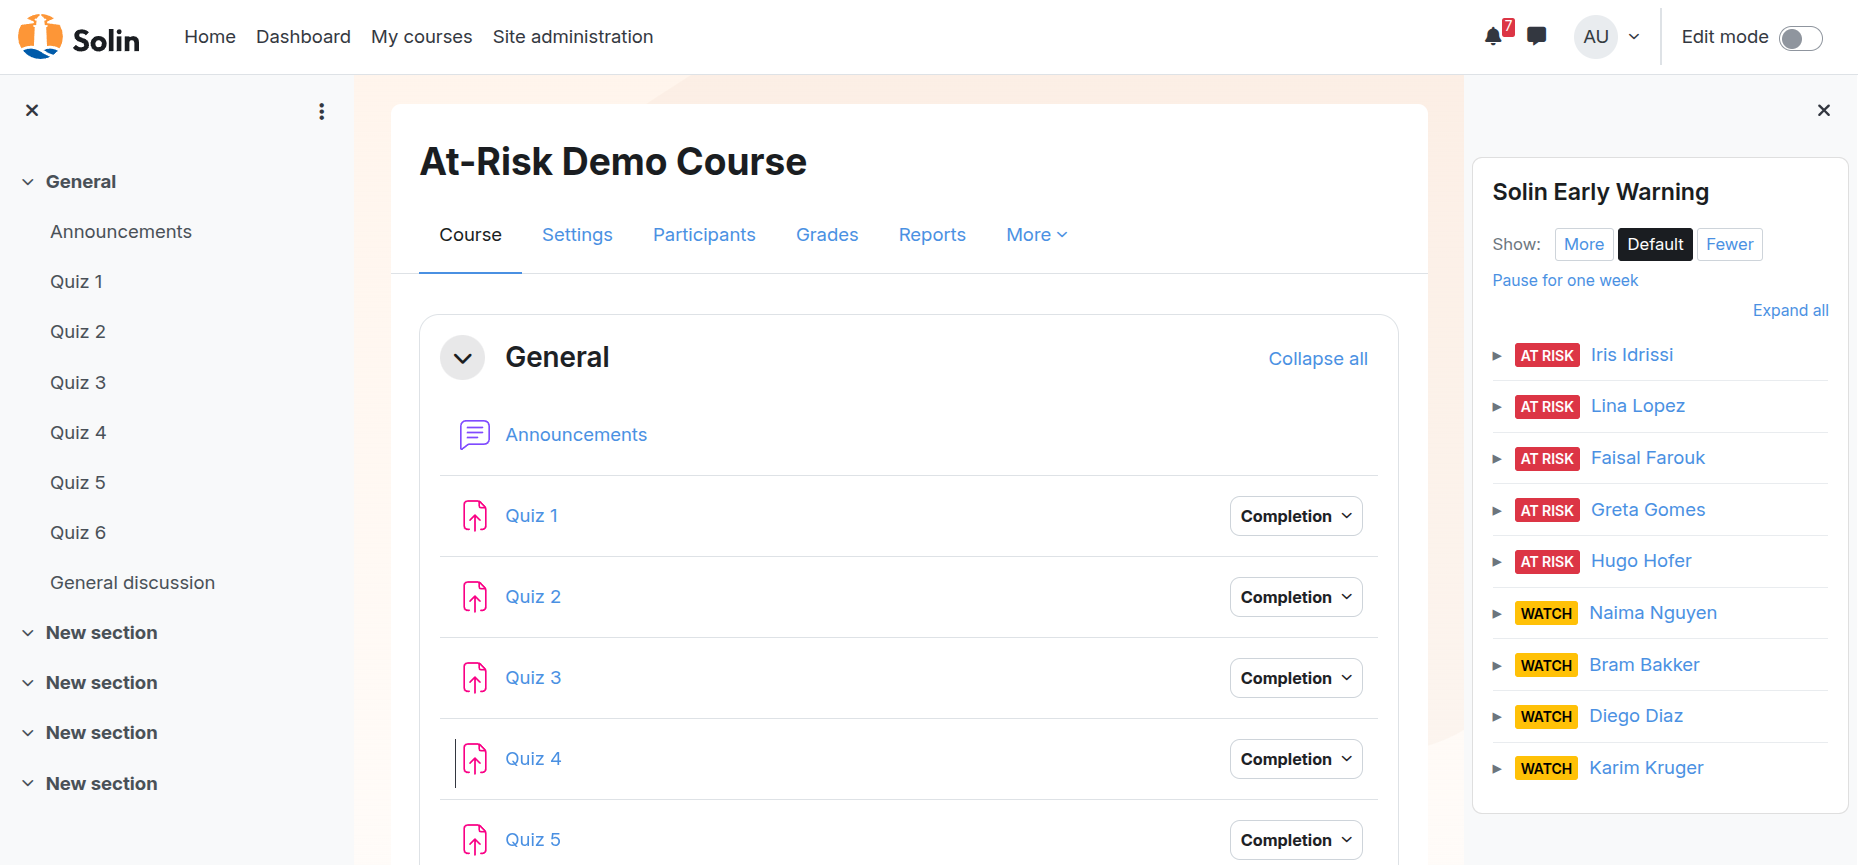
The Solin Early Warning block sits in the course sidebar, listing flagged students right next to the course content.
This guide explains how the heuristics work, the research behind them, and how you can tune the settings for your own courses.
Prefer to watch? Here is a short walkthrough of the block in action:
Before you start: Completion tracking
Before the block can use all of its signals, your course needs activity completion tracking enabled. Two signals depend on this: assessment miss and stalled completion.
For the assessment-miss signal to work, the relevant activities also need an “Expect completed on” date configured. If completion tracking is not enabled in your course, the block will still run using inactivity, grade trend, and optional forum silence, but it cannot tell whether students are missing expected activity completions.
The research: Architecture over magic numbers
The most authoritative public guidance on early warning systems (such as the 2018 NCES Forum Guide) explicitly states that universal “default” thresholds do not exist. What counts as at-risk in a short compliance module is very different from a 14-week university semester.
For this reason, Solin Early Warning provides a research-informed architecture with institution-tunable thresholds. The combination of signals is backed by empirical literature, but the exact numbers are conservative starting points that you are expected to tune.
To make this distinction visible, every default in the next section is labeled with its evidence type:
Strong empirical: the signal or threshold is directly supported by published studies.
Institutional convention: the most common starting value across documented practitioner sources, but not directly empirically validated.
Conservative starting point: a reasonable default that you should expect to tune for your context.
Contested: the empirical literature disagrees about whether the signal predicts what we think it predicts.
How the 5 signals work
The block evaluates students against five independent signals. If a student triggers any of these signals, they appear in the block.
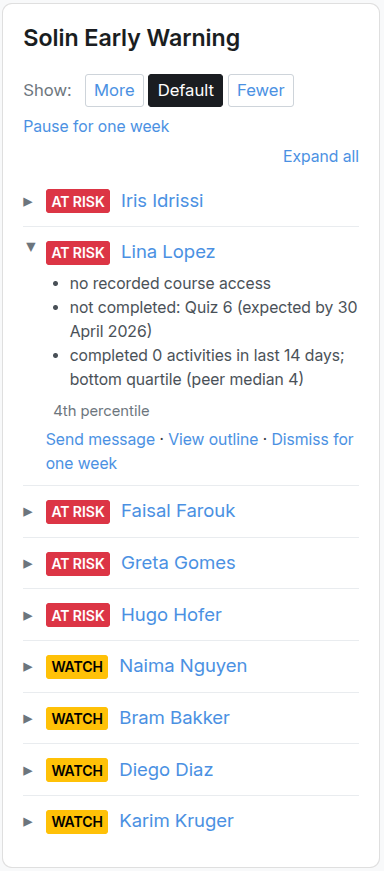
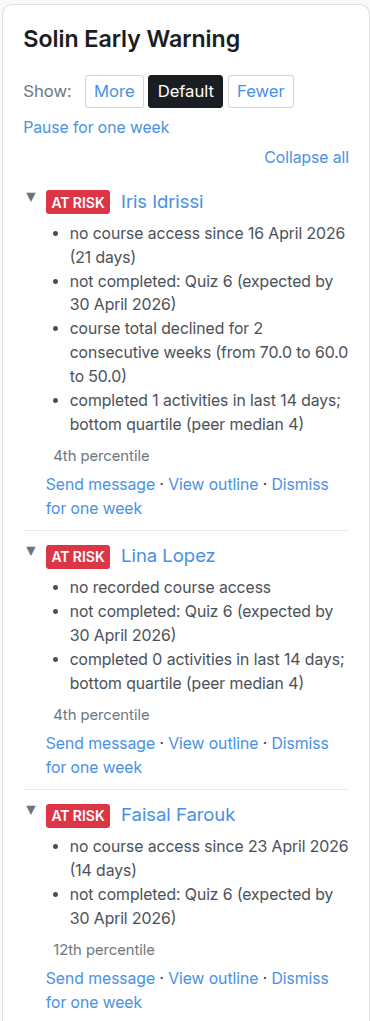
Each flagged student can be expanded to show exactly which signals were triggered, instead of an opaque score.
1. Inactivity (Default: 7 days)
How it works: Flags a student if they have not accessed the course in the last 7 days.
The research: The signal itself is well supported (course access is a basic engagement indicator across the literature). The 7-day threshold is institutional convention: a 7 to 15-day window is the most common starting value in higher-education practitioner sources.
Configuration advice: For short, fast-paced courses, tighten this to 3 or 5 days. For long-cadence or self-paced courses, widen it to 14 days or more.
2. Assessment miss (Default: 14-day window)
How it works: Flags a student who has not completed an activity whose expected completion date fell within the last 14 days. This applies to assignments, quizzes, SCORM packages, lessons, H5P activities, graded forums, and any other Moodle activity that uses completion tracking.
The research: Strong empirical support for the signal itself. Open University (OU Analyse) research shows that students who miss the first Tutor Marked Assignment have a very high probability of course failure; LAK 2025 confirms missed-deadline behavior as a strong predictor across more than 50,000 assignments. The 14-day window is a conservative starting point and is not itself empirically optimized.
Caveat: The signal uses the activity-level expected completion date. It does not yet account for per-student extensions (such as quiz access overrides or assignment user-flag extensions). A student given an extra week on Quiz 3 will still be flagged as “not completed” while their override is active.
3. Negative grade trend (Default: Enabled)
How it works: Flags a student whose course total grade has trended downward for two consecutive weeks. This signal only becomes available after the block has collected enough weekly grade snapshots.
The research: The broader literature supports academic performance and negative momentum as useful risk indicators, but the empirical evidence does not validate any specific delta or interval. We deliberately do not require a percentage drop. The “two consecutive weeks” rule is a conservative starting point.
4. Stalled completion vs peers (Default: Bottom quartile in 14 days)
How it works: Flags a student who is in the bottom 25% of the class for completing activities over the last two weeks.
The research: The Purdue Course Signals project made peer-relative activity a central part of its early-warning model, and the JISC case study identified it as a key differentiator from absolute-threshold systems. The idea is simple: a student’s activity level is easier to interpret when compared to the actual pace of the class. The specific “bottom quartile in 14 days” rule is a conservative starting point.
How it works: Flags a student with zero forum posts in the last 14 days, provided the rest of the class is actively posting.
The research: Contested. Some studies find forum participation significantly predictive; Rogers et al. (2025) find a weak negative correlation with academic performance. Vendor systems like Brightspace treat it as a core indicator, but that assumes forums are structurally central to the course pedagogy.
Configuration advice: Because of the contested evidence, this signal ships disabled. A site administrator can enable it under Site Administration → Plugins → Blocks → Solin Early Warning. Once enabled site-wide, individual teachers can override it per course (force on, force off, or inherit the site default) via the block’s gear icon. Only enable it if discussion forums are central to your course pedagogy.
How configuration works
Solin Early Warning has three layers of configuration, in order of reach:
Site-level defaults. Set by a site administrator under Site Administration → Plugins → Blocks → Solin Early Warning. These are the institution-wide defaults every block instance starts from.
Per-block-instance overrides. A teacher with the right capability can override site defaults for a specific course by clicking the gear icon on the block. The configuration form is explicit about what is overridden and what is inherited (it shows “Inheriting site default: 7 days” rather than just “7 days” so it is obvious when an institution-wide change will affect this course).
Inline sensitivity preset. The “Show: More / Default / Fewer” dropdown on the block header. This is the fastest way to recalibrate without leaving the course. It writes to the per-block-instance configuration, so a teacher’s preset persists across visits.
Most teachers will only ever use layer 3. Most administrators will only ever set layer 1.
Context matters: Percentiles, small classes, and calibration
Raw data is useless without context. The block includes specific features to make sure the flags make sense in the real world.
Peer-percentile rank and small classes
Next to every flag, the block shows the student’s percentile rank compared to their peers. If a student has not logged in for 9 days, the block will also tell you if that puts them in the bottom 10% of the class.
Expanded view: every flagged student with their per-signal reasons and peer percentile rank.
However, peer-relative signals need a meaningful peer group. In very small courses (fewer than 10 active enrollments), the block will automatically disable peer-relative signals because a single student can distort the comparison. In classes between 10 and 19 students, the block will show a caveat advising you to interpret the peer comparison with care.
The 4-week calibration window
Empirical studies repeatedly show that the first 3 to 5 weeks of a course are the highest-signal window for predicting dropouts.
Weeks 1 and 2: The block only flags students who have not accessed the course at all yet. Other signals are still gathering data.
Weeks 3 and 4: All enabled signals run, but flagged students are marked with a “Tentative” badge. This allows teachers to see the heuristics calibrating during the period when early intervention matters most.
Week 5 onward: The tentative badge is removed and the block runs with full confidence.
If you install the block on a course with no enrolled students, the block will say “Heuristics will activate when students enroll”. This is expected behavior, not a bug.
Holidays and term breaks
Time-based signals would otherwise produce a flood of false positives during institutional breaks: every student looks “inactive” during winter break, and any activity scheduled across the break window appears “missed”. The block handles this in three ways:
Site-level breaks calendar. A site administrator can declare institution-wide break ranges (Christmas, spring break, summer holidays) under the block’s site settings. Time inside those ranges is discounted in time-based calculations, so a holiday does not make students look inactive simply because the course was paused. Activities whose expected completion date falls inside a break are excluded from the assessment-miss signal.
Per-course break ranges. A teacher can declare ad-hoc break ranges for a specific course via the block’s gear icon. These add to the site-level list. Use this for course-specific pauses that do not apply institution-wide.
Pause for one week. A “Pause for one week” link in the block header is available to teachers and adds a one-week break to the current course. A “Resume now” link appears in the active-break banner if you need to end the pause early.
When the current render time falls inside a configured break, the block shows a banner explaining that the list reflects pre-break activity. When past breaks are dampening the current numbers, the block shows a small note explaining how many days of break time were excluded. The flagged list is never hidden during a break — it stays visible so a teacher preparing for resumption can see what is queued up.
Day-to-day use for teachers
The block is designed to be scannable and actionable within seconds.
Reading severity: A student who triggers exactly one signal gets a Yellow “Watch” label. A student triggering two or more signals gets a Red “At risk” label. The list automatically sorts the most severe cases to the top.
Adjusting sensitivity: Teachers will not use a tool that floods them with noise. In the block header, there is a “Show: More / Default / Fewer” dropdown. This allows you to instantly recalibrate the block for your course without opening the settings form. “More” adjusts the thresholds in the direction that shows more students. “Fewer” only shows the clearest cases.
Setting
More (shows more students)
Default
Fewer (shows fewer students)
Inactivity
5 days
7 days
14 days
Assessment-miss lookback
21 days
14 days
10 days
Forum-silence lookback
10 days
14 days
21 days
Grade trend
unchanged
unchanged
unchanged
Stalled completion
unchanged
unchanged
unchanged
The release valve (Dismiss for one week): If a student is flagged but you know the situation is already explained (for example: illness, a planned absence, or a temporary extension), you can click “Dismiss for one week”. The student is hidden from the list for 7 days. After that, they will reappear only if they still trigger one or more signals.
What about Moodle’s built-in analytics?
Moodle includes a Learning Analytics tool with a “students at risk” model. It is a different design choice: it uses a machine-learning backend (the PHP backend mlbackend_php ships bundled and is the default, with an optional Python backend mlbackend_python for larger sites) to predict dropout probability, and surfaces insights through Moodle’s messaging system, including email. It can suit institutions that are prepared to maintain the required analytics setup and that prefer push notifications.
Solin Early Warning takes a different approach: in-course visibility, transparent heuristics rather than ML, no email blasts, and an explicit per-signal explanation for every flag. Both can run on the same site. They answer different questions.
What this block does not do
Solin Early Warning does not predict dropout probability, and it does not replace teacher judgment. It does not use demographic profiling, student-background data, or a machine-learning model. It only uses observable Moodle course data and shows the reason for each flag.
A flag means: this student is worth checking. It does not mean: this student will definitely drop out.
Research behind this guide
The signal design and initial configuration defaults of the Solin Early Warning block are informed by the following sources:
Solin Early Warning is designed to make risk signals visible inside Moodle. For institutions that want a broader view across courses, Solin can also help review engagement patterns and tune the thresholds to the shape of your courses.
Certbot stores the webroot path it used during initial certificate issuance. If you later move Moodle's document root, for example, when separating the codebase from the data directory, Let's Encrypt HTTP challenge requests hit a 404 and auto-renewal fails silently until the certificate expires.
How Certbot’s webroot
validation works
The HTTP-01 challenge works by placing a temporary token file at:
/.well-known/acme-challenge/<token>
Let’s Encrypt then fetches that file over HTTP to prove you control
the domain. Certbot writes the token to a directory on disk and the web
server serves it. The directory it writes to is recorded when the
certificate is first issued and stored in the renewal configuration
file.
If the web server’s document root has changed since then, the file is
written to the old path, the web server cannot find it, and Let’s
Encrypt gets a 404. The renewal fails.
Diagnosing the problem
Run a dry-run renewal to see the error without modifying
anything:
certbot renew --dry-run
A failing renewal will show output like:
Attempting to renew cert (yourdomain.com) via certbot...
Challenge failed for domain yourdomain.com
http-01 challenge for yourdomain.com
Cleaning up challenges
Failed to renew certificate yourdomain.com with error:
Some challenges have failed.
Check the current webroot path Certbot has on record:
cat /etc/letsencrypt/renewal/yourdomain.com.conf
The webroot is recorded in two places in this file: a
webroot_path line under [renewalparams], and a
domain-to-path entry under the [[webroot_map]] subsection
(note the double brackets). Both point at the old document root:
Compare this against your Apache or Nginx virtual host configuration
to find the current document root. If they differ, that is the
problem.
Fixing it
Edit the renewal config file directly:
vim /etc/letsencrypt/renewal/yourdomain.com.conf
Update both the webroot_path line under
[renewalparams] and the entry under [[webroot_map]]
to the current document root. Editing only one of them is the usual reason
the fix appears not to take:
(certbot 2.3 and later also offer certbot reconfigure as a
supported way to change renewal parameters without hand-editing the file.)
Save, then test:
certbot renew --dry-run
If the dry-run succeeds, the next scheduled renewal will work
correctly.
Alternative: re-run
certificate issuance
If you prefer not to edit the config file manually, you can re-run
Certbot’s webroot mode, pointing it at the new path. This updates the
stored configuration as a side effect:
Use --force-renewal only in this recovery scenario, it
counts against Let’s Encrypt’s rate limits.
Checking
that the challenge path is web-accessible
Before the dry-run, verify the web server can actually serve from
/.well-known/acme-challenge/. On Apache, the default
WordPress or Moodle .htaccess sometimes redirects all
requests to index.php, which blocks the challenge path.
Check for a rule like this in your .htaccess:
RewriteRule ^ index.php [L]
If present, add an exception before it:
RewriteRule ^.well-known - [L]
On Nginx, verify there is no try_files or
return directive that catches all requests before the
challenge path can be served.
Automating renewal checks
Certbot installs a systemd timer or cron job for auto-renewal, but
failures are only logged, no alert is sent by default. Add a simple
check to your monitoring:
Or use ssl-cert-check to get an alert before the
certificate reaches a critical expiry window.
Every file Moodle serves goes through PHP by default. On sites with large video files or a high number of concurrent downloads, this ties up PHP-FPM workers for the duration of each transfer. Enabling X-Sendfile transfers that work to the web server, freeing PHP instantly.
Why PHP file serving is a
bottleneck
When a user accesses a file in Moodle, a video, a PDF, a SCORM
package, the request goes to pluginfile.php. Moodle checks
permissions, resolves the file from moodledata, and streams
it back to the browser. While the download is in progress the PHP-FPM
worker is occupied: it cannot serve other requests.
A single 500 MB video streamed to a user on a slow connection can
hold a PHP worker for 10–20 minutes. On a site with a limited FPM pool,
a handful of concurrent video viewers can exhaust all available workers,
making the entire site unresponsive.
How X-Sendfile works
X-Sendfile is a mechanism where PHP sets a response header instead of
sending the file body. The web server intercepts that header, locates
the file on disk, and streams it directly to the client. PHP exits
immediately, the FPM worker is released.
The header name differs by web server:
Apache: X-Sendfile (requires mod_xsendfile)
Nginx: X-Accel-Redirect
Moodle has built-in support for both.
Apache configuration
Install mod_xsendfile if it is not already present:
In your virtual host configuration, declare the paths that Apache is
allowed to serve via X-Sendfile:
XSendFile On
XSendFilePath /var/moodledata
XSendFilePath /var/www/moodle
The path must match the real filesystem path of
moodledata and, if your theme or plugin serves files from
the Moodle root, the Moodle directory as well.
Nginx configuration
Add an internal location block that maps to your moodledata
directory:
location /moodledata-internal/ {
    internal;
    alias /var/moodledata/;
}
The location name is arbitrary, it just needs to match what Moodle
will put in the header.
Moodle configuration
In config.php, add:
// Apache (mod_xsendfile):
$CFG->xsendfile = 'X-Sendfile';

// Nginx (X-Accel-Redirect): set the header type AND map the
// real moodledata path to the internal location name.
$CFG->xsendfile = 'X-Accel-Redirect';
$CFG->xsendfilealiases = array(
    '/moodledata-internal/' => $CFG->dataroot,
);
There is no $CFG->xsendfilepath setting in Moodle. For
Apache, setting $CFG->xsendfile = 'X-Sendfile'
is all Moodle needs; the allowed paths are declared on the Apache side
with XSendFilePath (above). For Nginx,
Moodle requires $CFG->xsendfilealiases: each key is the
internal location name you defined in the Nginx config, and each value is
the real filesystem path it maps to. If the file Moodle is serving does
not match any alias, X-Sendfile silently does nothing and Moodle falls
back to serving through PHP, so the alias key must match the
location block name exactly (including the trailing slash).
Verifying it works
After enabling, inspect the response headers on a file download:
Without X-Sendfile the response body comes directly from PHP. With
X-Sendfile the PHP response will have Content-Length: 0 and
the X-Sendfile header will be present (stripped by the web
server before sending to the client, but visible in debug mode).
A simpler check: watch FPM worker utilization during a large file
download with
watch -n1 'php-fpm8.2 -t 2>&1; ps aux | grep php-fpm | grep -v grep | wc -l'.
Without X-Sendfile the count stays elevated for the duration of the
download. With X-Sendfile the worker count drops back to baseline within
seconds.
Caveats
moodledata must not be web-accessible directly.
X-Sendfile only works because Moodle’s PHP code runs first to enforce
access control. The web server then serves the file after PHP has
authorised it. Never point a public Alias or
root directly at moodledata.
Symlinks: if moodledata contains
symlinked directories (some backup or filedir configurations do this),
ensure mod_xsendfile or Nginx is configured to follow them,
or the file lookup will fail.
PHP memory: X-Sendfile also eliminates the memory
overhead of reading the file into PHP before sending. This is
particularly relevant for ZIP files or large SCORM packages where PHP
would otherwise buffer the entire file.
When a Moodle scheduled task crashes mid-run, the lock it held can prevent the task from running again. This guide explains how Moodle's task locking actually works, how to identify a stuck task, and how to clear it without disrupting active tasks. If the problem turns out to be broader than one stuck task, work through the Moodle troubleshooting checklist.
How Moodle task locking
works (and why it usually self-heals)
Every scheduled and ad-hoc task acquires a lock before it runs, so two
processes cannot run the same task at once. The important detail is
where that lock lives, because it determines whether a crash
leaves a stuck lock behind.
By default Moodle does not use file locks. When
$CFG->lock_factory is unset, Moodle auto-selects a
database lock factory based on your DB: mysql_lock_factory
(MySQL/MariaDB GET_LOCK()) or postgres_lock_factory
(PostgreSQL advisory locks). These locks are tied to the database
connection. When a task process crashes, is OOM-killed, or the server
restarts, the connection drops and the database releases the lock
automatically and immediately. So on a standard MySQL or
PostgreSQL site, a crashed task does not leave a stale lock; the next run
acquires the lock normally and the task recovers on its own.
A persistent stuck lock is therefore the exception, not the rule. It
happens when the site has been explicitly configured to use a
non-connection-based factory, namely the file lock factory
(file_lock_factory, locks under $CFG->dataroot/lock/)
or the database-record factory (db_record_lock_factory, locks
in the lock_db table). Those do not auto-release on a dropped
connection, so a crash can strand a lock. Before hunting for a lock to
delete, confirm which factory your site uses: if $CFG->lock_factory
is not set in config.php, you are on the auto-released DB
locks and the cause of a non-running task is almost certainly something
other than a stale lock (see the diagnostics below).
Identifying the stuck task
The scheduled task log is the first place to check:
Site administration > Server > Tasks > Scheduled task log
Filter by the task name and look for a run that started but has no
matching completion entry, or check the last run time, if it is hours
older than the configured schedule, the task is likely locked.
From the database:
SELECT classname, lastruntime, nextruntime, timestarted
FROM mdl_task_scheduled
WHERE timestarted > 0
ORDER BY timestarted DESC;
For ad-hoc tasks (queued jobs from enrolments, messaging, etc.):
SELECT classname, timestarted, timecreated, faildelay
FROM mdl_task_adhoc
WHERE timestarted > 0
ORDER BY timestarted;
A row with a timestarted value and no corresponding
completion means the task is either still running or was abandoned
mid-run. Cross-check against running PHP processes:
ps aux | grep php
If there is no matching process for the task, the lock is stale.
Clearing a stale lock (only if you use a non-default factory)
On the default DB lock factory there is nothing to delete: a crashed
task's lock is already gone. Manually re-running the task (below) is all
that is needed. The steps here apply only if your site explicitly sets a
file or database-record lock factory.
File lock factory ($CFG->lock_factory = 'corelockfile_lock_factory'):
locks are files under $CFG->dataroot/lock/. Inspect them, and
remove only a file older than the task's expected duration with no matching
running process:
ls -la /var/moodledata/lock/
Database-record factory
($CFG->lock_factory = 'corelockdb_record_lock_factory'):
locks live in the lock_db table. The key for a scheduled task
is cron_ followed by its class name:
SELECT id, resourcekey, expires FROM mdl_lock_db;

DELETE FROM mdl_lock_db WHERE resourcekey = 'cron_\core\task\send_new_user_passwords_task';
Deleting rows from mdl_lock_db is a direct production
database write: take a backup first, and confirm no live process is
holding the lock before removing it.
Whichever factory you use, re-run the task manually to confirm it
recovers:
Some tasks, H5P content sync, Turnitin submission checks, large
report generation, can run for several minutes and hold a lock for the
entire duration. When they share a cron invocation with fast tasks, a
slow run blocks or delays everything that follows.
Run heavy tasks on their own dedicated CLI invocation, separate from
the general cron:
# In a separate cron entry:
php /var/www/moodle/admin/cli/scheduled_task.php
  --execute='\mod_turnitintooltwo\task\submission_scores_sync'
This keeps the general cron moving and gives you independent control
over the frequency and timeout of the heavy task.
Persistent ad-hoc task
backlogs
Ad-hoc tasks that repeatedly fail accumulate a faildelay
value and are retried with increasing backoff. A large backlog combined
with a lock issue can cause the queue to grow faster than it drains.
Check the queue depth:
SELECT classname, COUNT(*) AS queued, MAX(faildelay) AS max_delay
FROM mdl_task_adhoc
GROUP BY classname
ORDER BY queued DESC;
Tasks with a high faildelay and a large count are
candidates for investigation. If the failure is environmental (a
third-party API that was down, a missing file), clearing
faildelay and resetting timestarted lets them
retry immediately:
UPDATE mdl_task_adhoc
SET faildelay = 0, timestarted = NULL
WHERE classname = '\core\task\asynchronous_backup_task'
AND faildelay > 0;
Only do this once you have resolved the underlying cause.
Moodle cron fails silently more often than you'd expect. This guide explains how to detect those failures reliably using an external heartbeat monitor, and walks through the code that implements it as a Moodle plugin.
Why Moodle’s
built-in cron status is not enough
Moodle shows a “Last cron run” timestamp in Site
administration > Server > Tasks > Scheduled tasks.
That value is written when a cron run starts, not when it
finishes. A run that hits a PHP fatal error, exhausts available
memory, or gets stuck on a locked task still updates the timestamp
before it stops.
The result: the admin panel shows a recent timestamp, everything
looks normal, but no tasks have completed for hours.
The dead man’s switch pattern
An external cron monitor works as a dead man’s switch:
At the end of a successful cron run, your server sends a signal, a
simple HTTP GET request, to a URL that the monitoring service
provides.
The service expects to receive that signal on a schedule you
define.
If the signal does not arrive within the expected window, the
service sends an alert.
The monitoring service has no access to your server. It only waits
for the ping.
Why a scheduled
Moodle task doesn’t work here
The obvious approach would be to add a scheduled task that runs last
and fires the ping. Moodle doesn’t support that. There is no “cron
finished” event, and you cannot configure a task to run after all
others.
More fundamentally: if cron is broken, a scheduled task inside that
cron cannot reliably fire. You need the monitor to live outside of
Moodle’s task scheduler.
The approach: a wrapper
script
The solution is to replace the direct cron invocation with a
pipe:
The 2>&1 merges stderr into stdout so that PHP
errors are captured alongside normal output. The wrapper script receives
everything on stdin, inspects it, and fires the appropriate ping.
The key check
Moodle’s cron script writes one predictable string when it completes
successfully:
Cron run completed correctly
The wrapper reads stdin and looks for that string:
$input = file_get_contents('php://stdin');

if (strpos($input, 'Cron run completed correctly') !== false) {
    ping_cron_monitor('success');
} else {
    ping_cron_monitor('failure');
    send_logs_email($input);
}
If the string is absent, because cron crashed, was killed, or timed
out, the failure branch runs: it fires the failure ping and emails the
full cron log to the configured recipients.
Sending the ping
The ping itself is a GET request to a configurable URL. Inside a
Moodle CLI script you have the full Moodle stack available, so you can
use Moodle’s own curl class:
require_once($CFG->libdir . '/filelib.php');

$curl = new curl();
$curl->get($url);
Having the URL configurable from within Moodle admin, rather than
hardcoded in a shell script, means an administrator can change the
monitoring endpoint without touching the server.
Storing the URL as a Moodle
setting
A single admin settings page handles all configuration. The success
and failure URLs are stored as plugin config values:
$settings->add(new admin_setting_configtext(
    'tool_cronmonitor/cron_monitor_success_url',
    new lang_string('cron_monitor_success_url', 'tool_cronmonitor'),
    new lang_string('cron_monitor_success_url_desc', 'tool_cronmonitor'),
    '',
    PARAM_URL
;
You configure a monitor on any dead man’s switch service that accepts
HTTP pings. Set the expected interval to match your cron schedule and
add a grace period long enough to cover normal load variation. When
pings stop arriving, the service sends an alert through whatever channel
you choose, email, SMS, webhook.
Edge cases
OOM kills: If PHP is terminated by the operating
system before producing output, the pipe closes without the success
string. The monitoring service will not receive a ping within the
expected window and will alert. The email log in this case will be empty
or partial, check dmesg for OOM killer entries.
Parallel cron runs: The wrapper applies only to the
CLI invocation managed by the system cron job. If you run multiple
parallel cron processes or use a cron daemon, each invocation needs its
own pipe.
Reading stdin:
file_get_contents('php://stdin') works in most setups, but
on some systems the stream is not immediately available. A fallback
using fopen and fgets is worth adding for
robustness:
Solin maintains a custom cron-monitoring admin tool that packages all of
this: the wrapper CLI script, the admin settings, optional email
notifications with the full cron log on failure, and a master on/off
toggle. It is built for client sites and is not publicly available. Contact Solin if you would like it set up on
your installation.
Monitoring a Moodle web server requires both datacenter-level alerting and application-specific checks. This guide covers configuring your hosting provider's monitoring tools, adding site-specific metrics, and tracking trends over time.
Goal of Monitoring
The goal of monitoring is to ensure that the system, i.e. the web server and all software on it, is working properly and within established parameters. If at any time a website or a subsystem on the web server stops functioning, a signal should be sent out to the sysop, who maintains the system.
In addition, it should also be possible to examine trends over time, or historic data, to evaluate whether or not the system’s resources should be expanded (or scaled back) in the future.
You will notice that we are relying on two monitoring systems now: one provided by the data center, and a monitoring system based on Webmin, which is an administrative system for (web) servers. The reason for adding Webmin’s monitoring is that the data center does not allow you to monitor specific websites, but Webmin does.
1. Check Monitoring Settings of the Data Center
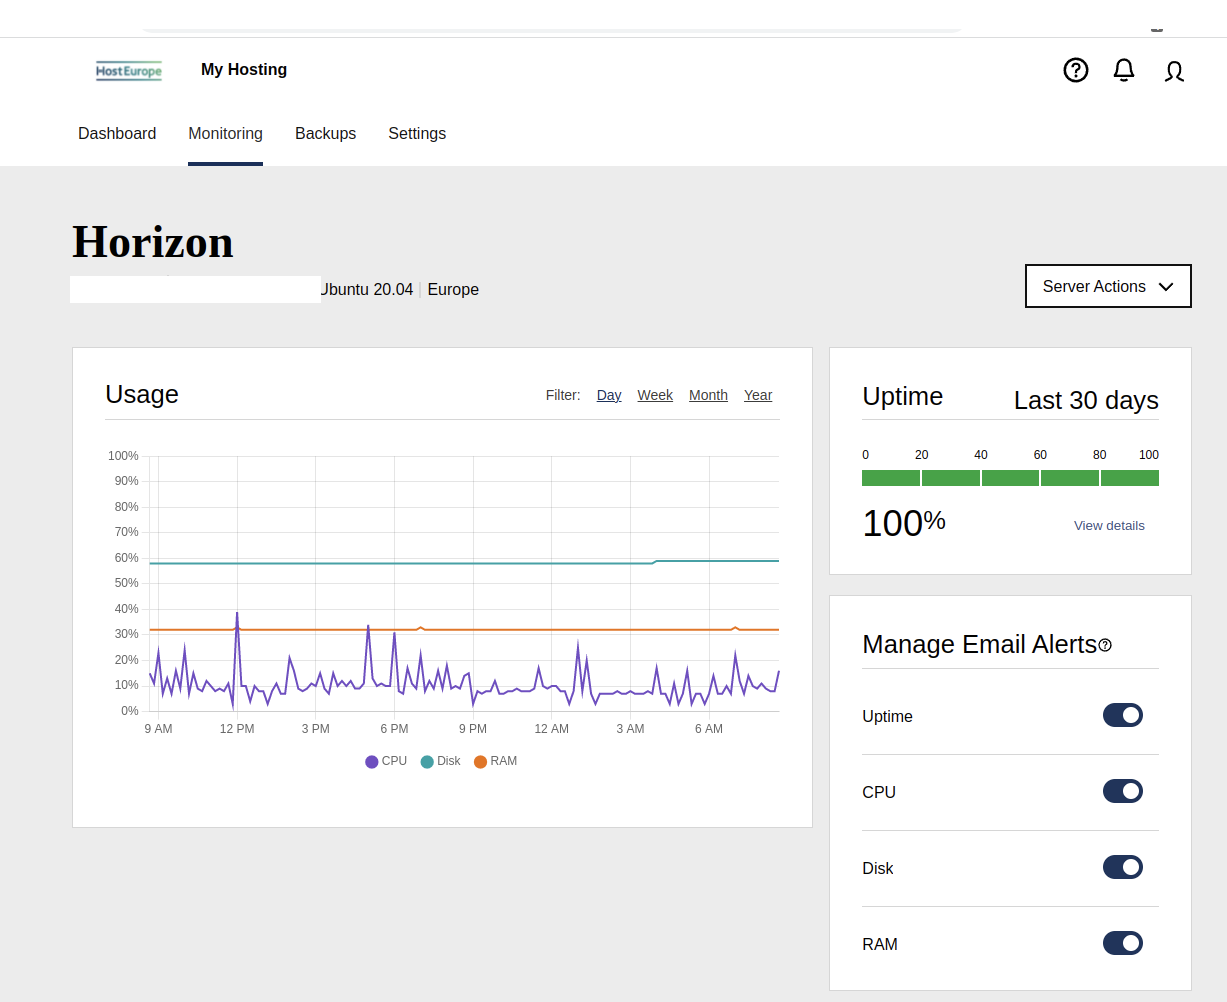
The data center may have its own monitoring that comes pre-installed and configured with a new web server (VPS). Just make sure that everything is set up correctly.
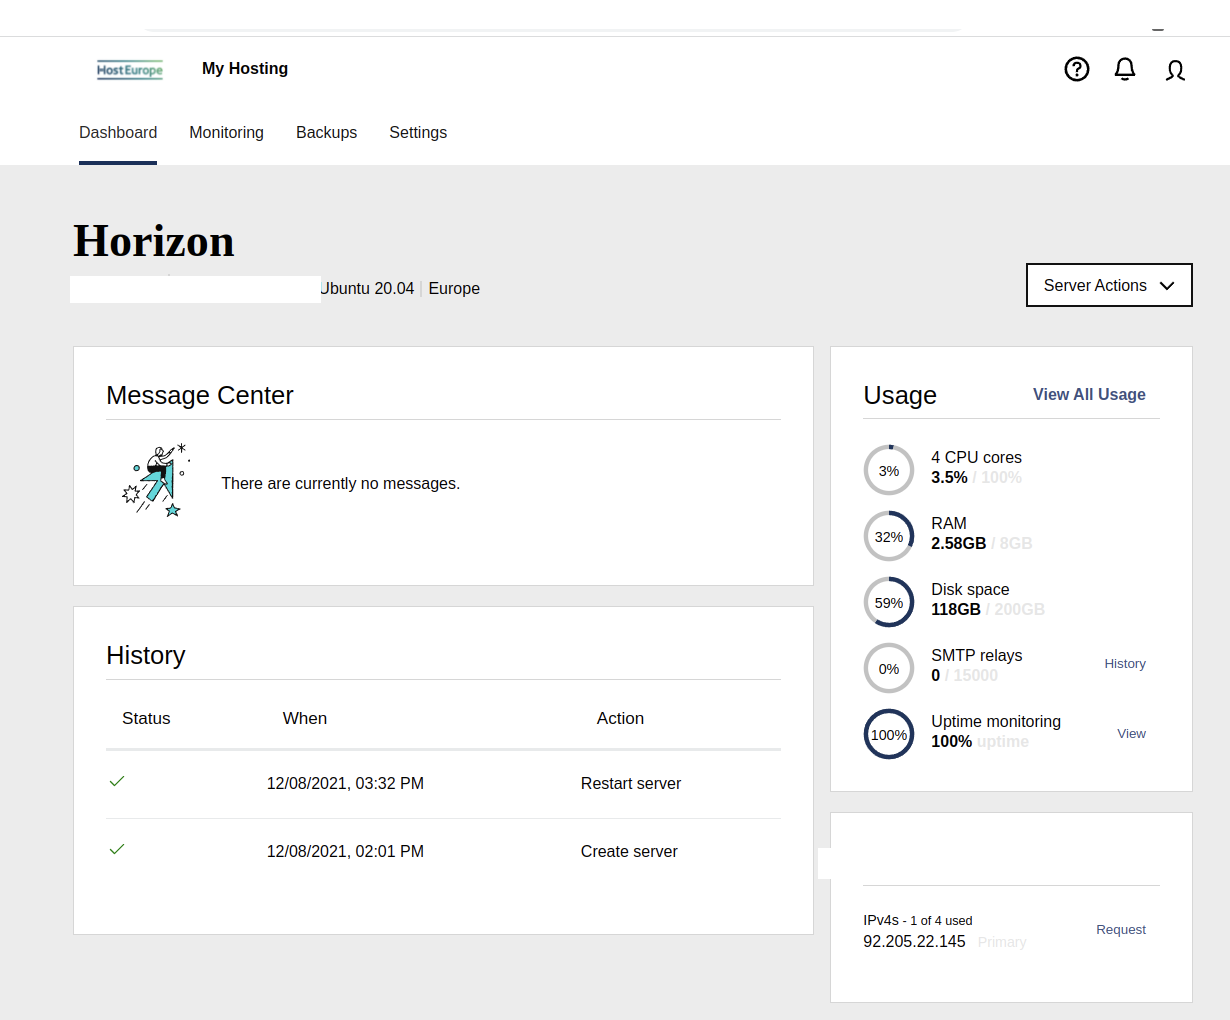
The exact location of these settings depends on your provider’s control panel, but most expose the same resource metrics. Sign in to the panel and open the dashboard for your server to check current usage. As a rule of thumb:
CPU and RAM should stay below 80%.
Disk space should stay below 95%.
The outbound SMTP/relay count is typically 0 if the server does not send email.
Uptime is ideally 100%, though it may dip slightly over time.
Many panels also plot these metrics over time and let you toggle email alerts per metric. Where the control panel offers email alerts, switch them on so the account owner is notified when CPU, disk, or RAM usage crosses 80%.
External Monitoring
It is also recommended to add an external monitor. An external monitor is a monitor that resides on another system. For instance, you can use cronitor.io for free to perform a GET request every five minutes to a website on the server you want to monitor. Don’t forget to add your email address so you will receive notifications when the monitor fails.
Using an external monitor ensures you get alerted if the server goes down even if the entire data center goes down with it.
Heartbeat Monitor
We have a custom plugin, tool_heartbeat, which can be used to send out an “I’m alive” signal to cronitor.io (or a comparable service). Use this tool to make sure Moodle’s (or Totara’s) cron is still working.
Here's how it works:
The Moodle or Totara site stops telling Cronitor "I'm alive!" for whatever reason. (The Heartbeat plugin does this, hence the name.)
Cronitor notices Totara is no longer alive, waits 5 minutes just in case, and then sends out an alert "Type: Alert" ("Event not received on schedule").
If (when) Totara is reanimated, Cronitor sends out an alert "Type: Recovery".
So, in the email messages from Cronitor, "Alert" means there's a problem, and "Recovery" means it's fixed.
Installation and configuration
Place the contents of this directory inside the /admin/tool/heartbeat folder relative to your Moodle or Totara install path.
Configure the cron job to * * * * * php /path_to_your_moodle/admin/cli/cron.php | php /path_to_your_moodle/admin/tool/heartbeat/cli/cron.php > /dev/null
Plugins settings
Cron monitor: Enable the monitor and add the url of the external cron monitor service
Email settings: Enable the email notifications, add the email subject and body, select recipients that get the email.
2. Make sure Webmin is Installed
Our standard procedure is to install Webmin, an administrative system for web servers. So Webmin should be installed and accessible, typically through the hostname and the 10000 port, e.g.: https://vps2.example.internal:10000/.
If it is not installed, please see the installing a new Moodle website.
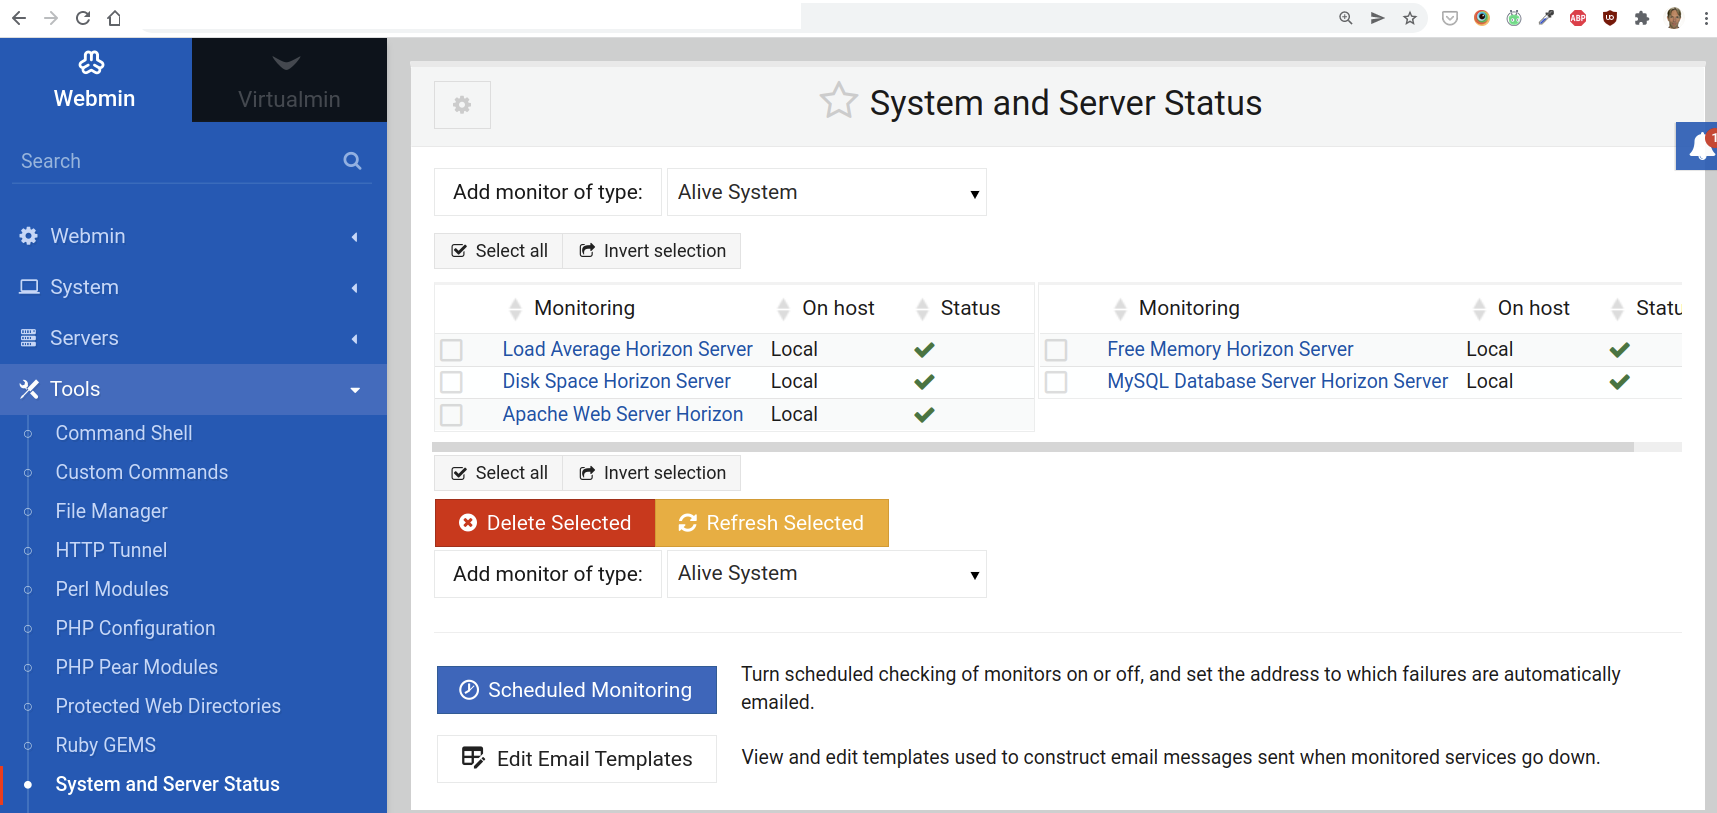
3. Configure Webmin to Monitor Critical Systems and Websites
Go to Webmin and open the Tools >System and Server Status section:
We need to add five types of monitors:
Load average: what is the average usage of the system in during the last 15 minutes
Disk space: how much is left on the disk (typically an SSD drive)
Apache web server: is the web server up and running?
Free memory: how much free memory do we have left?
MySQL database server: is the database server up and running?
To add a new monitor in Webmin, use the select box next to the button Add monitor of type and then click the button.
Settings for All New Monitors
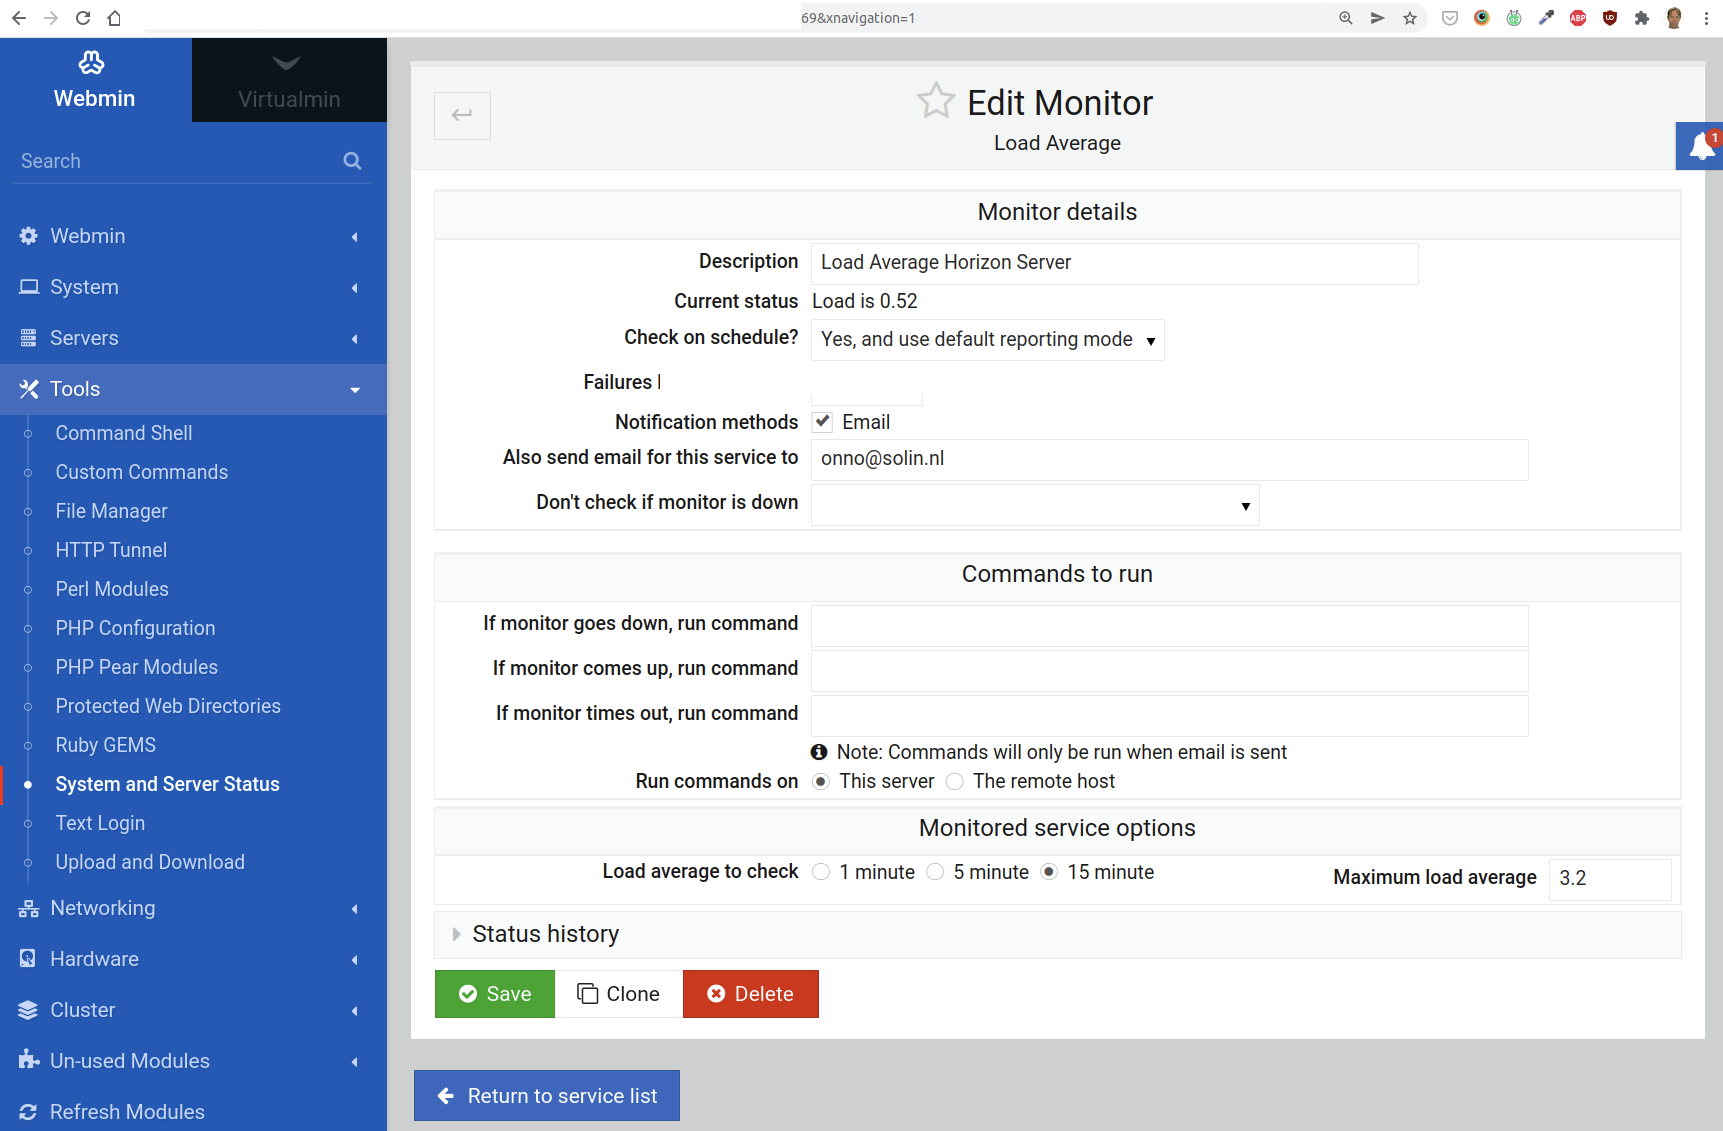
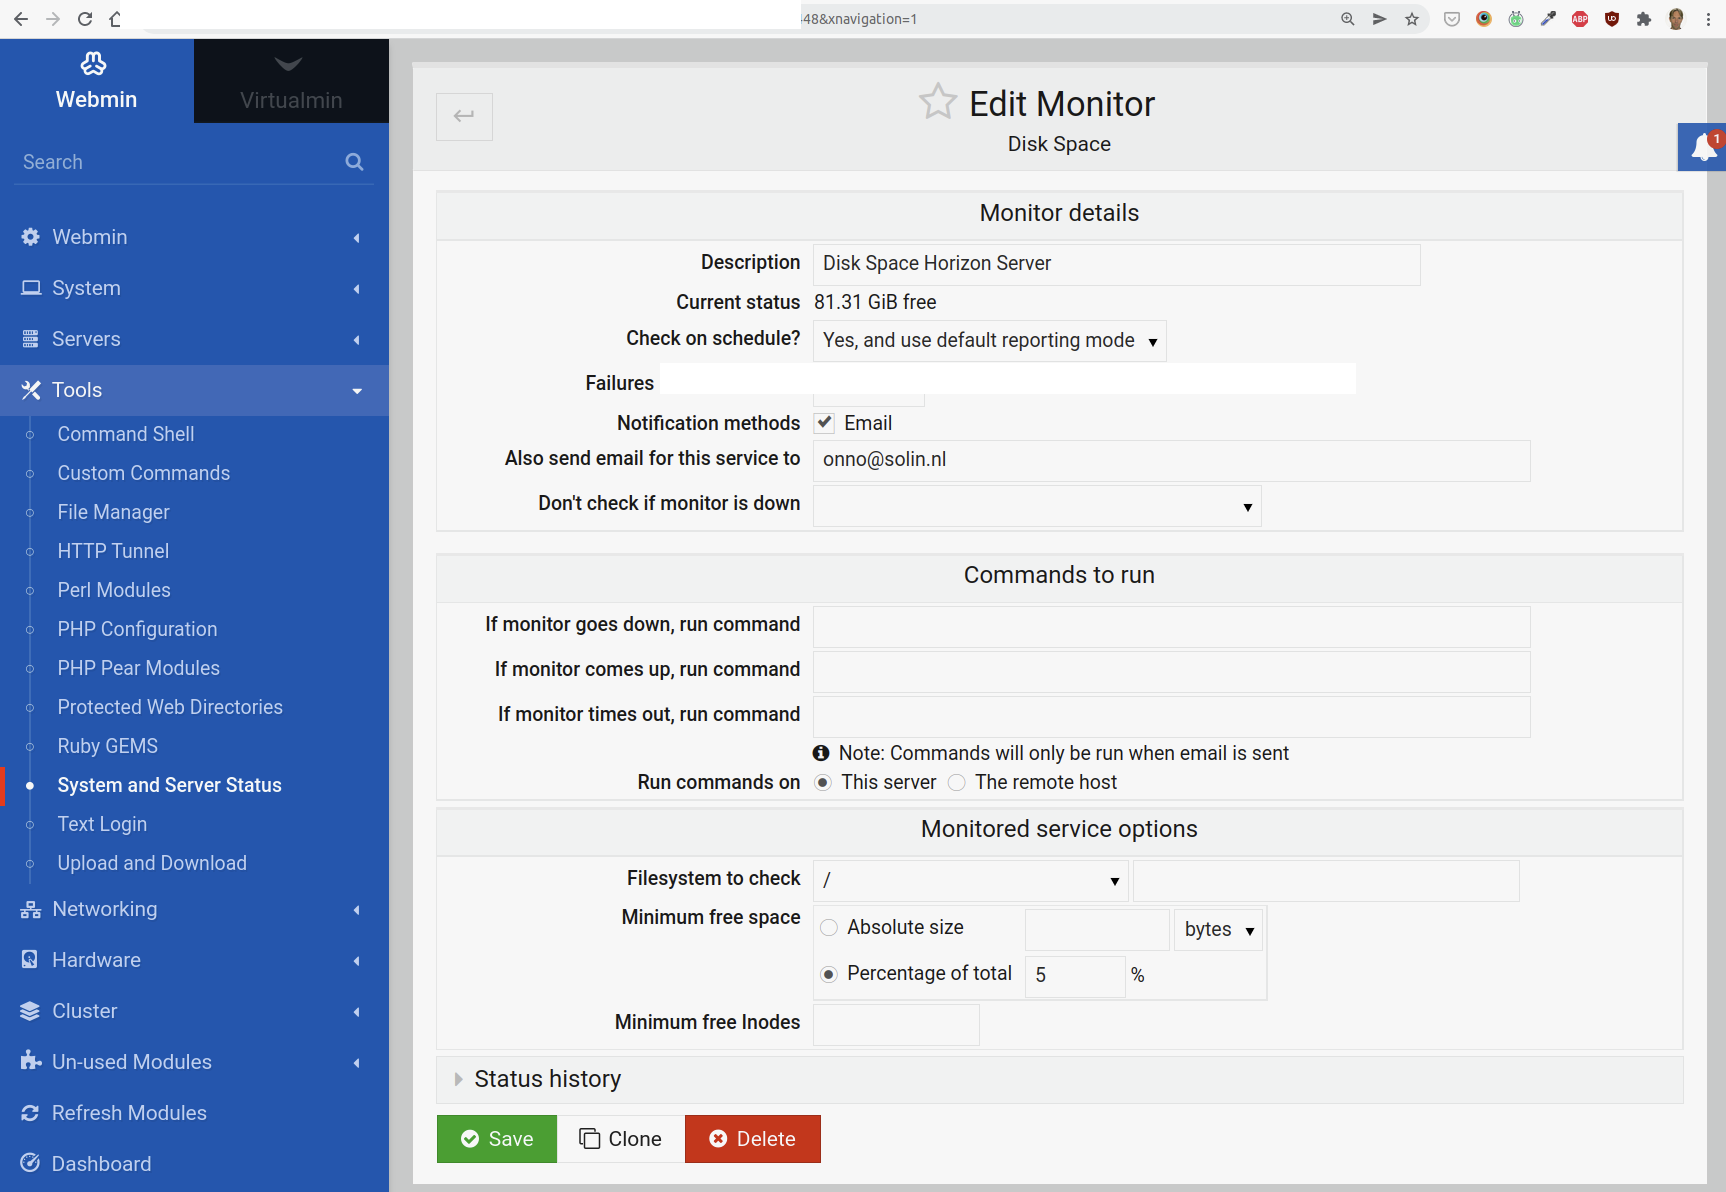
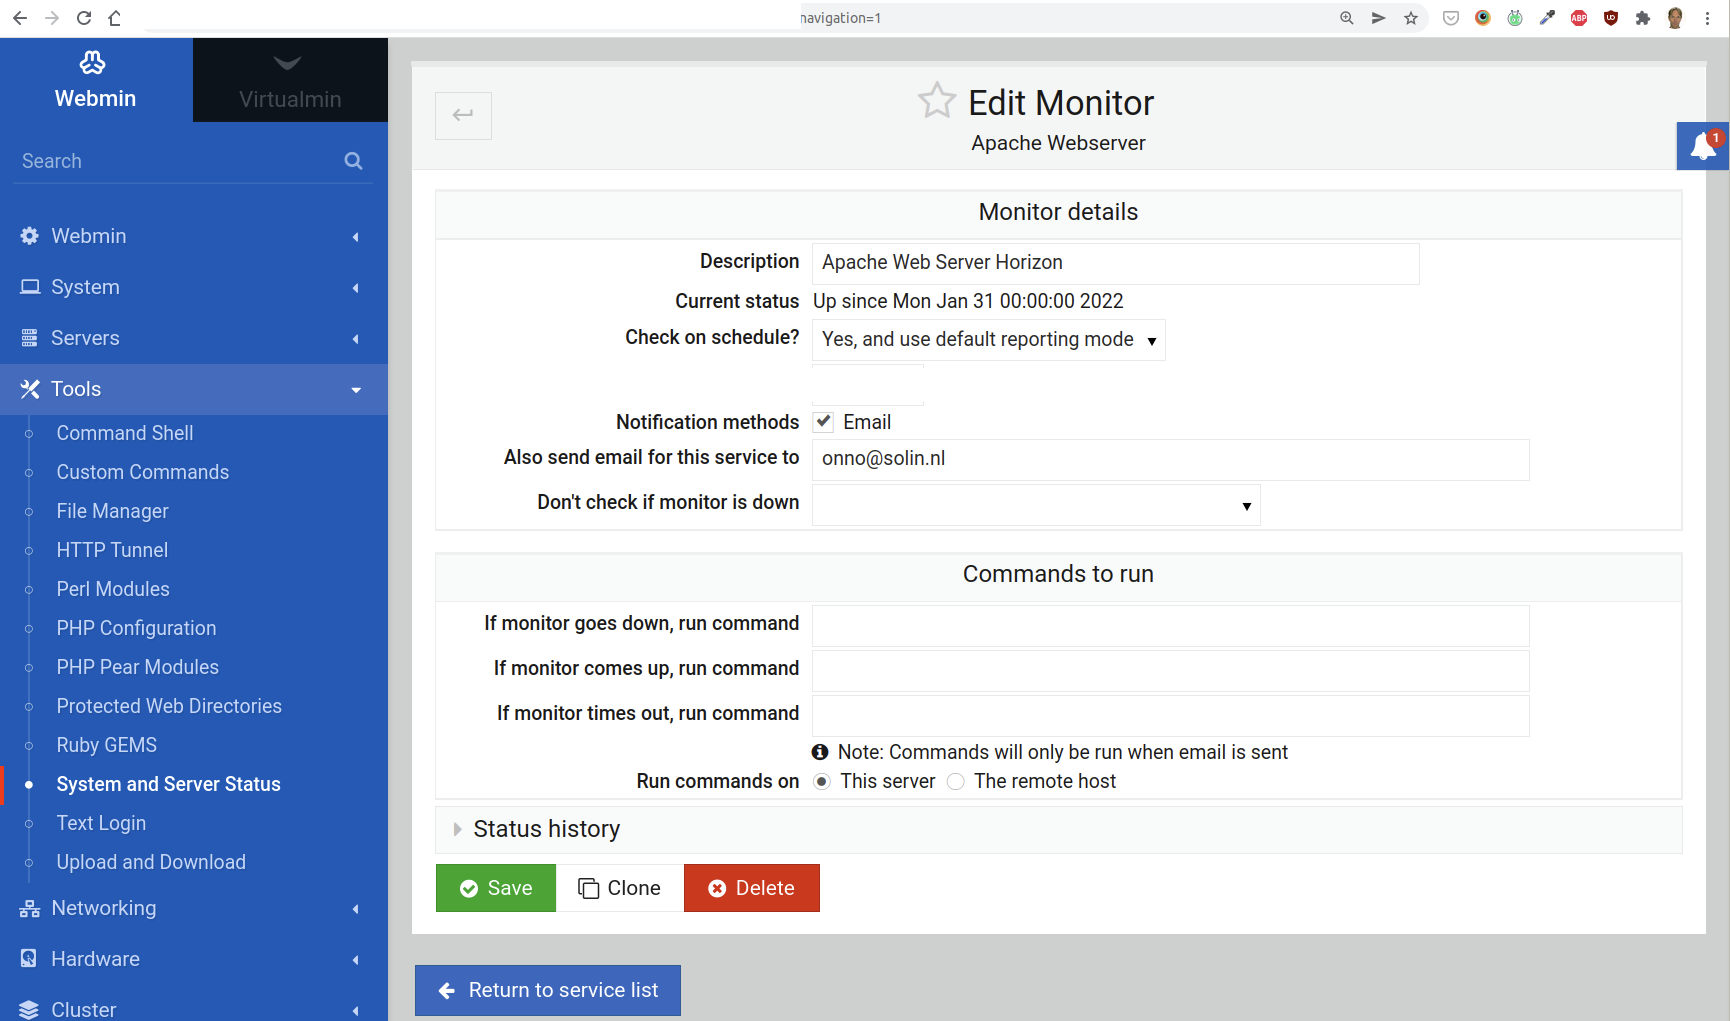
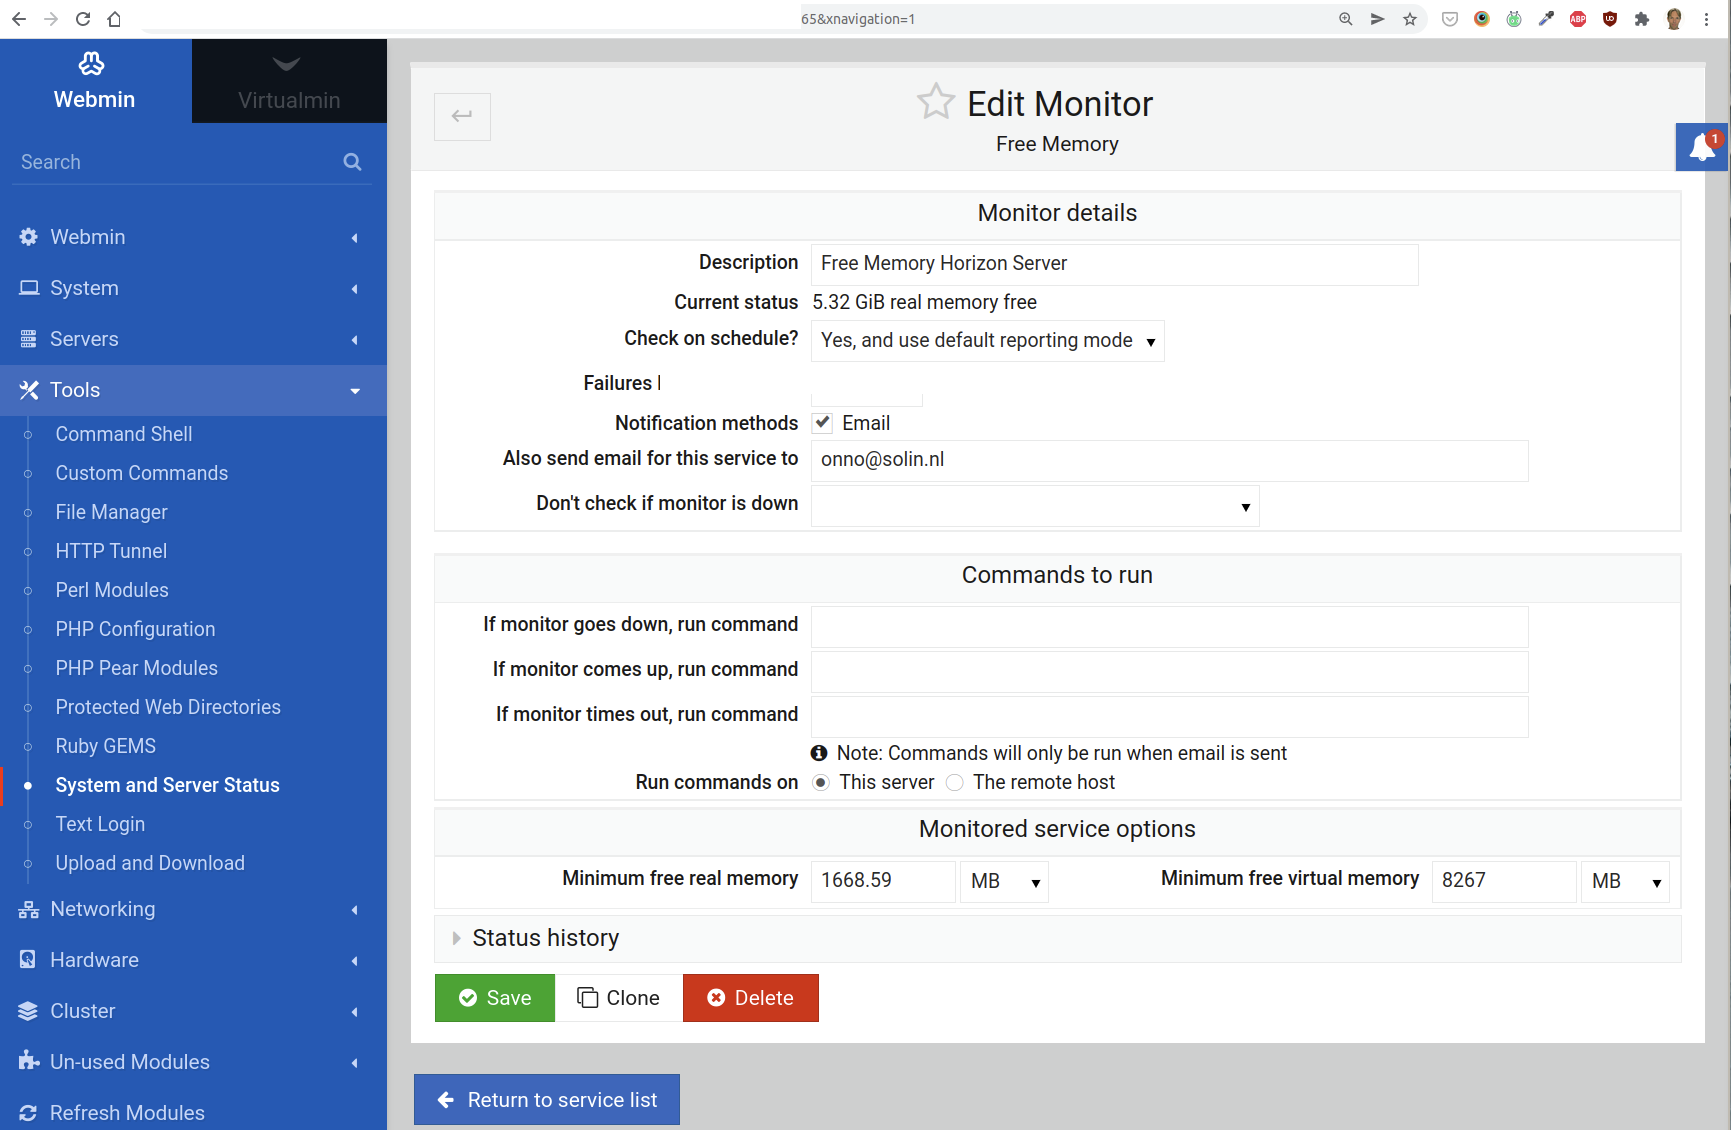
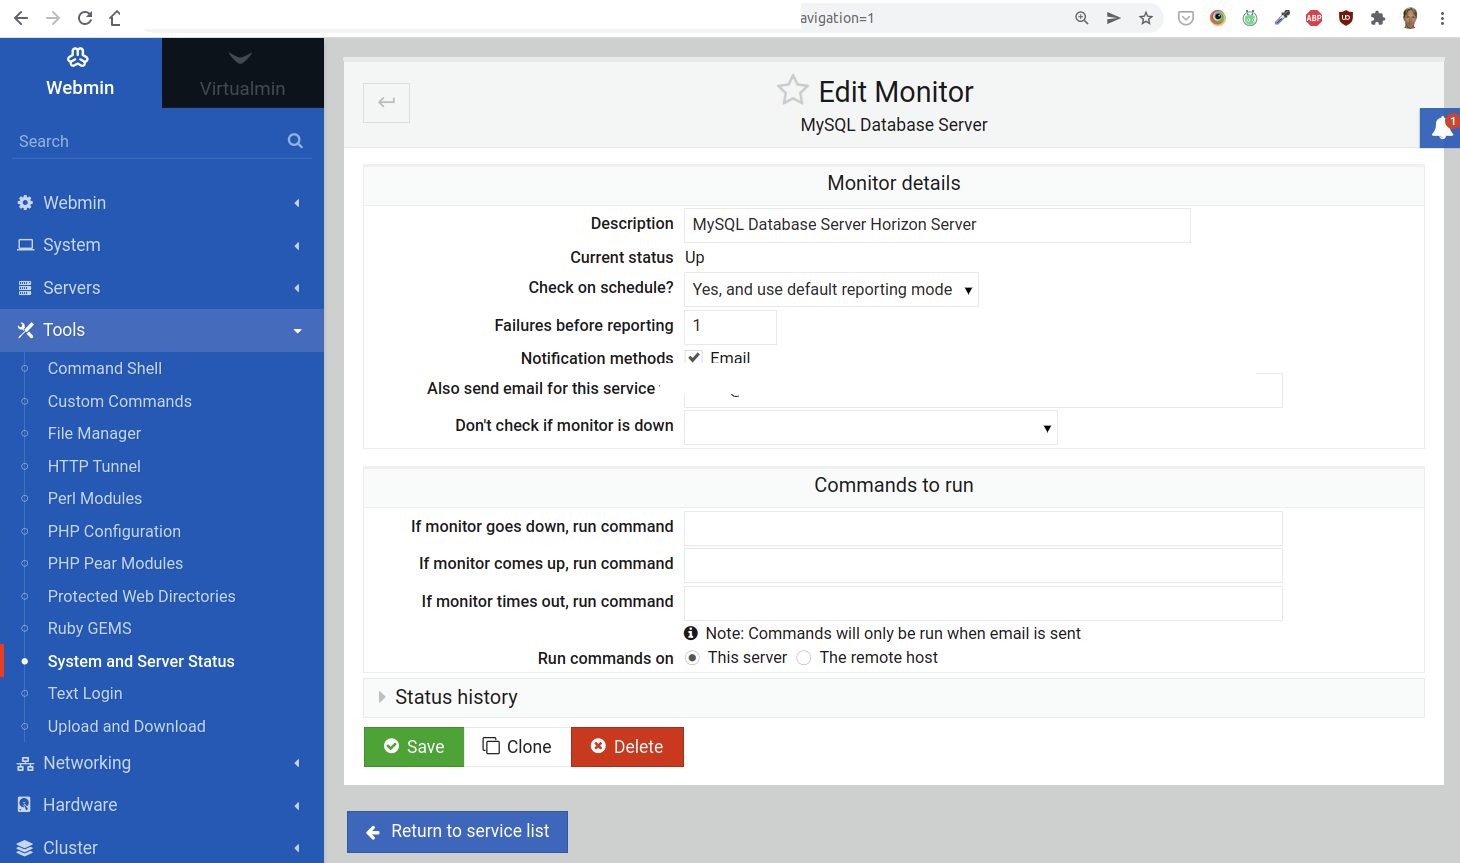
For all new monitors, do not forget to add a Description that includes your users’s name (or main website), and fill out the field “Also send email for this service to” with the address of the person in the sysop role for this server. Set the field “Failures before reporting” to 1. (See the screenshots below for some examples of where to find these fields.)
Load Average Monitor
The average load is the usage of the system (mainly CPU usage) during the past 5, 10 and 15 minutes. To get a good perspective, we set this monitor to 15 minutes, under Load average to check.
The Maximum load average value is critical: it should not exceed 80%. The actual value to fill in, is based on the number of CPU cores. This is the computation:
n cores x .8
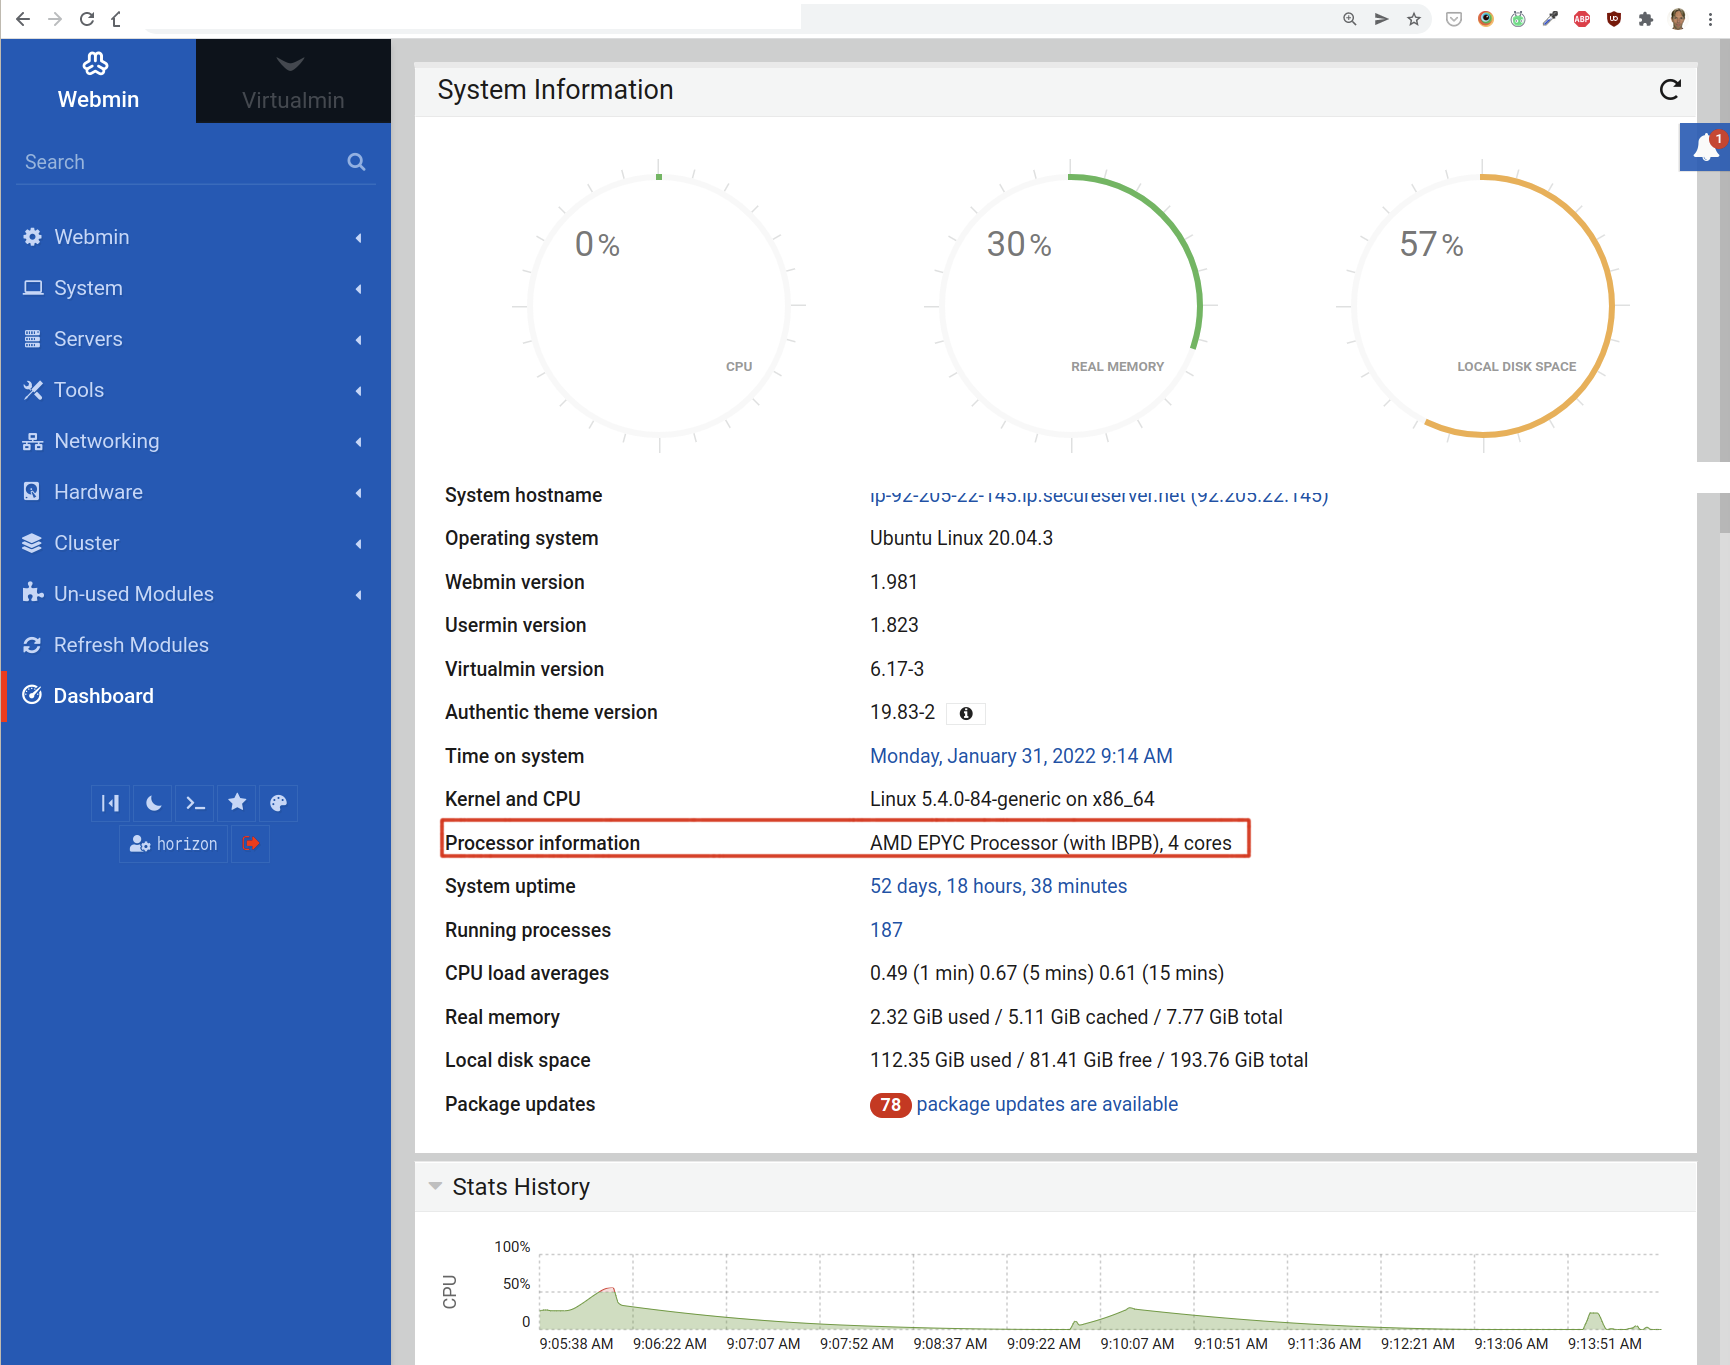
For instance, 1 core is 0.8, and 4 cores gives you a value of 3.2.
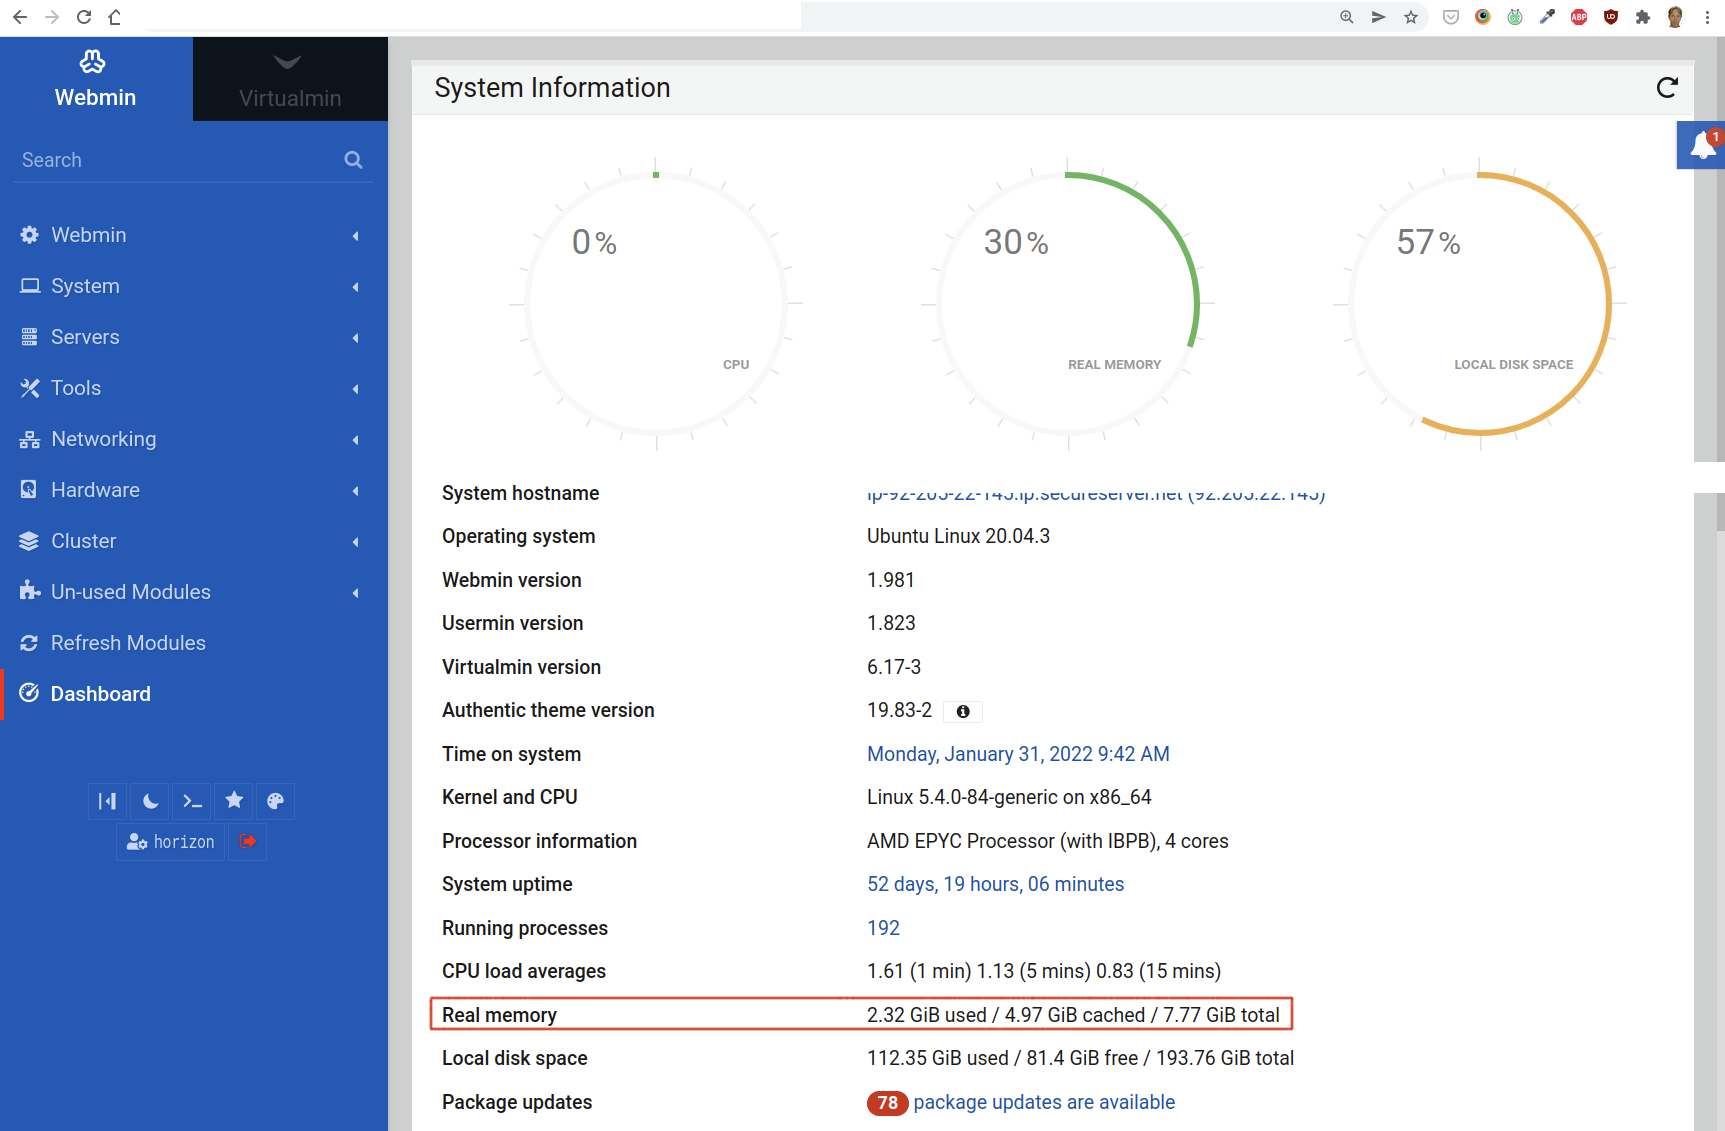
The number of cores can be retrieved from Webmin as well. Simply go to Webmin’s homepage and look for Processor information. There you find the number of cores:
This is pretty straightforward: just fill in 5%. This should send out an alert if the disk is over 95% capacity. Filesystem to check is /.
Apache Web Server Monitor
The defaults for this monitor should be fine.
Free Memory Monitor
For this monitor, two values are critical:
Minimum free real memory: we want 20% to be free (or max 80% used)
Minimum free virtual memory: we want this set equal to the amount of physical RAM.
To compute the 20% minimum free RAM, we need to know the total available real memory. You can find this on the “homepage” of Webmin:
Webmin reports the total memory in Gigibytes (GiB). But the Free Memory monitor uses megabytes (MB). To convert the free memory from GiB to MB, use the following formula:
MB = 1073.74 x n GiB
For instance, if we have 7.77 GiB that gives us 8342.9598 MB. Of this number, we take 20% to fill in for the minimum free real memory, and 25% of the virtual memory as the “Minimum free virtual memory”.
MySQL Database Server Monitor
The defaults for this monitor are fine. Make sure that the “Failures before reporting” field is set to 1 and that the “Also send email for this service to” field is filled in.
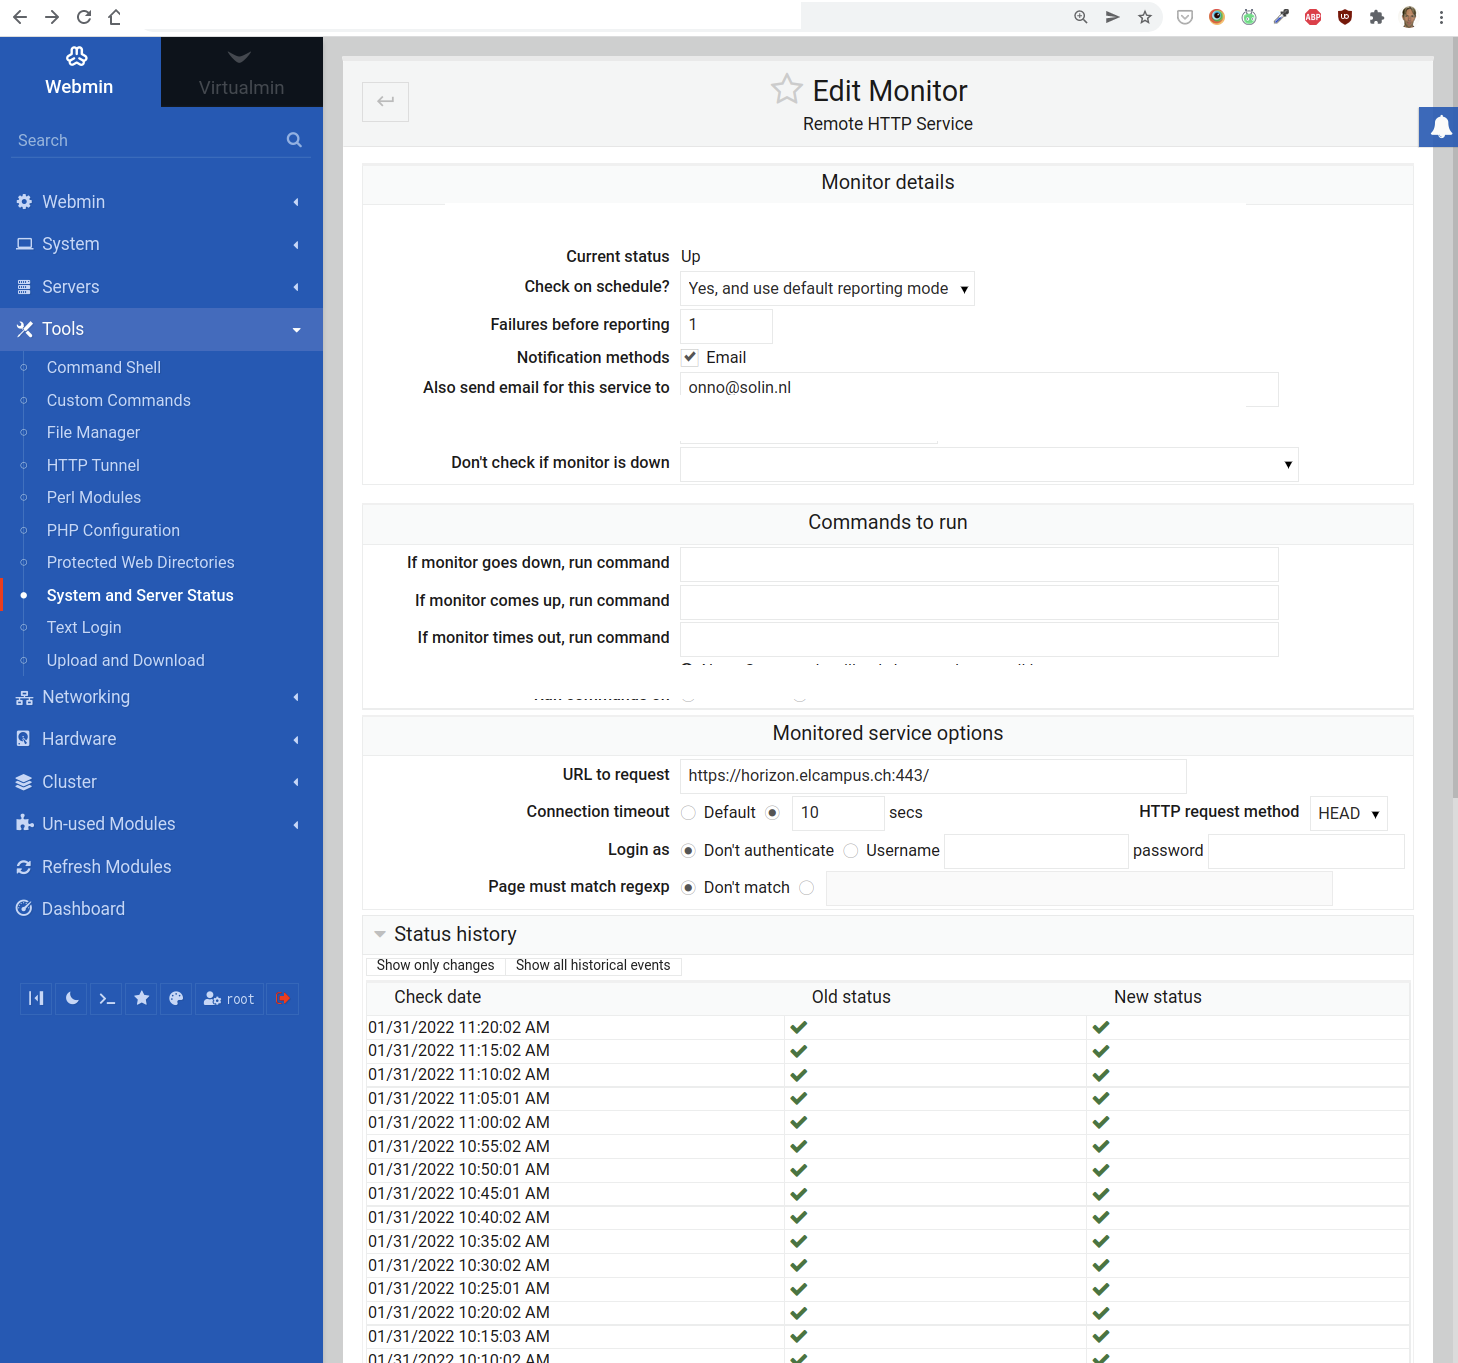
4. Add a “Remote HTTP Service” Monitor to Another Webmin
What happens if the entire web server is out or can no longer be reached? In that case, all the monitors we added in the section above will no longer run, or if they are still running, their email alerts may not reach you.
To counter this, we add a “Remote HTTP Service” monitor to a Webmin installation on another web server entirely:
As you can tell from the Status history, this check is performed every 5 minutes.
Set the field “Connection timeout” to 10 seconds. This should also notify you if the loading times for the Moodle website get unacceptable (i.e. more than 10 seconds).
5. Test the Monitoring
Testing should only be done on a completely new system that is not in use yet. The monitors are typically working – they consist of proven, well tested software. So we will not be testing that the monitoring software works, but mainly that we have configured it correctly.
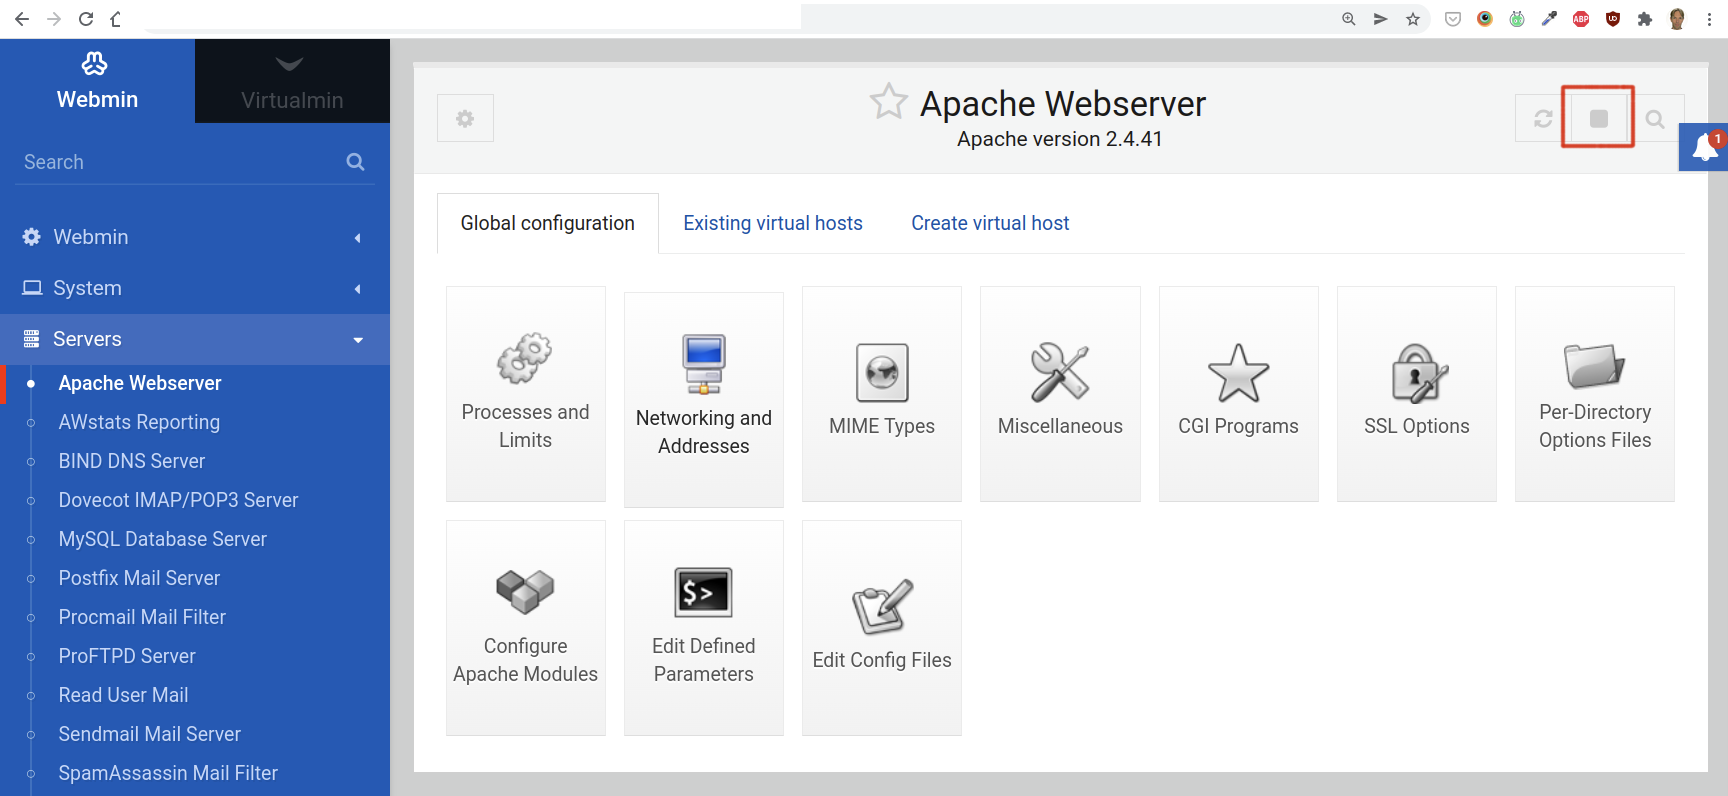
The most critical monitor is the one for the actual Moodle website. We test this by simply turning off the web server. This can be done in Webmin.
Go to Servers > Apache and click the stop button, but only on a new system that is not in use yet:
If you have configured the Remote HTTP Service monitor correctly, you should receive an email very soon.
Restart the Apache web server by clicking on the play button.
You can also stop and start Apache on the command line:
If you do not receive any email, make sure that you have used the correct email address, and the correct url (including the port: nowadays almost always 443).
6. Install a New Munin Node on the Web Server
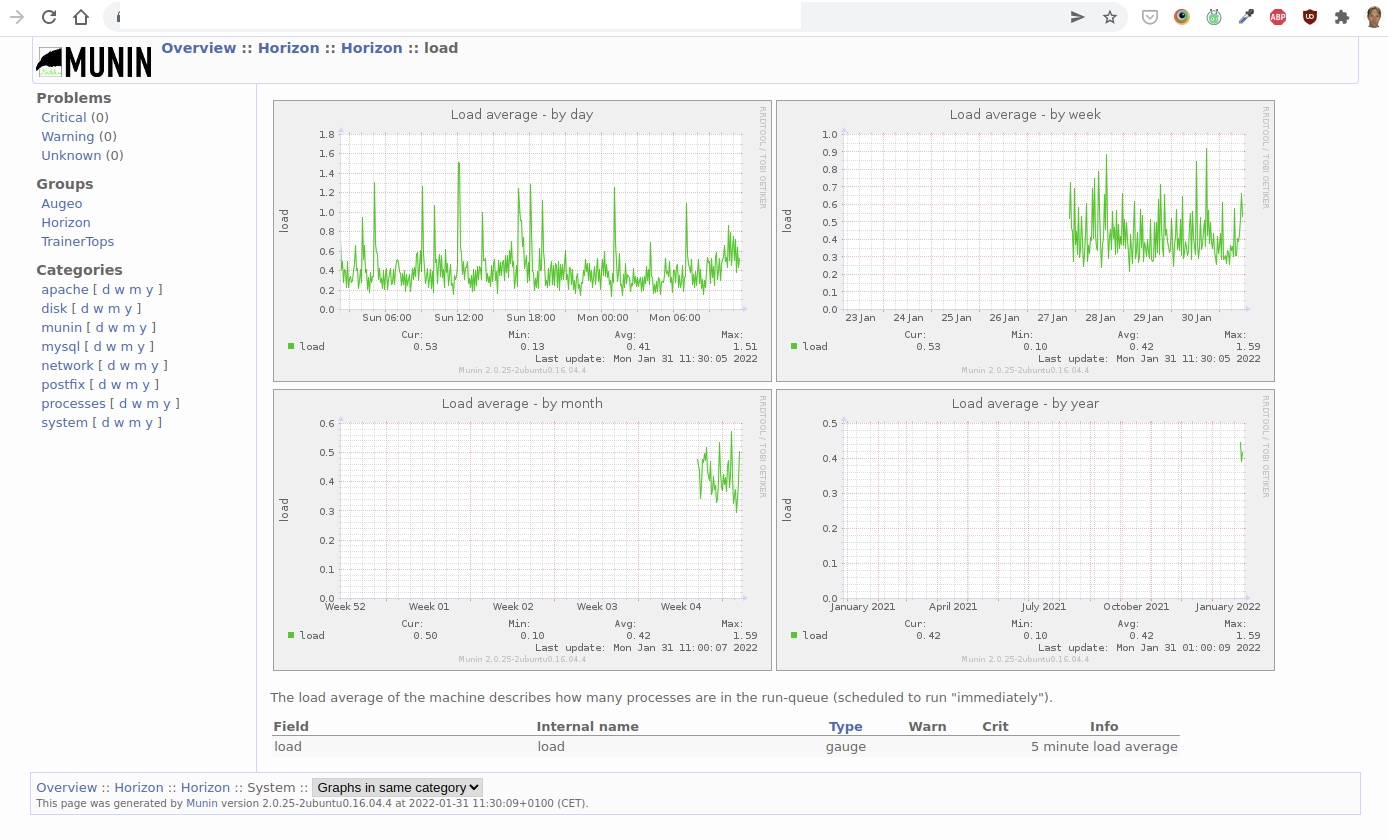
Munin is a logging tool which consists of a server and a node. The node is installed on the system that you want to monitor. The server is where you login to view the historical data. We already have the server in place.
If you login to monitoring.example.internal, you will see an overview of the systems that we are currently monitoring through Munin. Click on a specific system to view the details. Here is an example of the history of the load average:
To install the node on a new web server:
Make sure that the library libparse-http-useragent-perl is installed, e.g.:
sudo apt-get install libparse-http-useragent-perl
Install munin:
apt-get install munin
apt-get install munin-node
Make sure that the Apache’s server-status module is enabled. (You can do this through Webmin.)
Add the ip address of the Munin server (i.e. the “master”) to /etc/munin/munin-node.conf:
allow ^xxx.xxx.xxx.xxx$
Configure the munin plugins.
Configuring The Munin Plugins
The default plugins for the node (so, on your Munin “client” web server) are in /usr/share/munin/plugins/. They appear in your munin website if they're symlinked in /etc/munin/plugins. For instance:
In /etc/munin/plugins, add symlinks to the apache plugins:
You must also configure them in the file /etc/munin/plugin-conf.d/munin-node. In that file, if you want to configure multiple plugins at once, use an asterisk notation. E.g.:
[apache*]
This addresses all apache plugins, which are by default:
apache_accesses
apache_processes
apache_volume
Usually when you look at the source code of the plugins (they're mostly perl scripts), you will find configuration instructions. For instance, the apache plugins need access to Apache's server status, so you have to configure Apache (i.e. httpd.conf):
<Location /server-status>
    SetHandler server-status
    Order deny,allow
    Deny from all
    Allow from 127.0.0.1
</Location>
ExtendedStatus on
We should also mention here that some plugins seem to exclude each other. For instance, the apache_average_time_last_n_requests plugin (not installed by default) seems to exclude the other (default) apache plugins.
Finally, restart the node:
/etc/init.d/munin-node restart
And open the firewall for port 4949.
Please note: if any of the Munin plugins fail, you will not see any date from that Munin node on the server (monitoring.example.internal)!
Configure The Munin Server
Finally, you also have to tell the Munin server to start polling the newly added node. Add the ip address of the node server to the file /etc/munin/munin.conf:
[ArbitraryServerName] # Apparently, you can't use spaces in this name
    address xxx.xxx.xxx.xxx
    use_node_name yes
The Munin server (the 'master') will read the new values within 5 minutes (the default polling interval).
Detailed Monitoring
If you run into any trouble with a VPS, you can add more detailed monitoring.
Performance Monitoring
The following is a monitoring script based on an email exchange with Hosting Provider, May 19th 2022 about the website outages on their VS10 Linux VPS (search for 198.51.100.43 #HE-DE:2ad1f7b4109530473 in the email history).
date >> /var/log/custom-monitoring.log; top -n 1 -b >> /var/log/custom-monitoring.log; lsof -ni >> /var/log/custom-monitoring.log
This log will contain detailed performance information which you can use to identify which particular application is causing high load, for instance.
Explanation:
date: current date and time
top: display linux processes;
-n 1: Specifies the maximum number of iterations, or frames, top should produce before ending.
-b: Starts top in Batch mode, which could be useful for sending output from top to other programs or to a file. In this mode, top will not accept input and runs until the iterations limit you've set with the `-n' command-line option or until killed.
lsof: lists on its standard output file information about files opened by processes
-i: selects the listing of files any of whose Internet address matches the address specified in i. If no address is specified, this option selects the listing of all Internet and x.25 (HP-UX) network files.
-n: selects the listing of files any of whose Internet address matches the address specified in i. If no address is specified, this option selects the listing of all Internet and x.25 (HP-UX) network files.
Log File Rotation
This type of monitoring generates a lot of data, so put it in log file rotation, see Webmin > System > Log File Rotation (the one for /var/log/letsencrypt/*.log is a good example).
Use the default settings, except for:
Rotation schedule: Daily
Number of old logs to keep: 31, so you will always have at least a month's worth of data.
Compress old log files?: Yes.
Slow Query Monitoring for MySQL
MySQL has a slow query log which records all queries which took longer than 10 seconds (by default) to execute. For Moodle, 10 seconds is not realistic because many queries take longer than that, so 30 seconds is probably better.
To activate slow query logging:
Login using the mysql client: sudo mysql -uroot -p
set global slow_query_log = 'ON';
set global slow_query_log_file ='/var/log/mysql/slow-query.log';
set global long_query_time = 30;
Confirm the changes are active by re-entering the MySQL shell (this reloads the system variables) and running the following command: show variables like '%slow%';
Make sure the slow-query.log is in log rotation (see subsection Log File Rotation).
Incident Response
If you receive an alert from either monitoring system, take the following steps:
Verify the alert
If normal usage was impeded, i.e. there was an actual outage, notify your users, with an estimated time to fix if possible
Fix the issue
Take steps to prevent this from happening again (and document them in a relevant SOP)
If there was an outage, notify your users that the issue is now fixed and what you have done, or will do in the very short term, to prevent a recurrence of the incident.
Appendix – Health Monitoring on Servers Without Webmin
Purpose
This section describes how basic server health monitoring is implemented on systems where Webmin is not installed or not permitted.
Instead of relying on a web-based administration interface, monitoring is achieved using:
a lightweight Bash script
systemd timers
standard Unix tooling (mail, logrotate)
This approach minimizes attack surface, avoids additional services, and is fully auditable.
Rationale (Why No Webmin)
Webmin provides convenient monitoring and administration features but:
introduces an additional web-facing service
increases maintenance and patching requirements
is not always allowed under security policies
For these reasons, this server uses a script-based monitoring approach that:
requires no open ports
has no daemon processes
depends only on standard OS components
provides clear alerting and diagnostics
Monitoring Scope
The health check verifies the following:
Disk usage on the root filesystem (/)
System load (1-minute average, normalized per CPU core)
Available memory (MemAvailable)
Required services:
apache2
postgresql
Local HTTP availability via http://127.0.0.1/
On failure:
a diagnostics snapshot is appended to a log file
an alert email is sent
On success:
a single “OK” line is written to the log
no email is sent
Installation
Prerequisites
Ensure mail utilities are installed:
apt update
apt install mailutils
Postfix is already present on this system.
Script Installation
Create the monitoring script:
vim /usr/local/sbin/healthcheck.sh
Insert the full script source provided below.
Set permissions:
chmod 0755 /usr/local/sbin/healthcheck.sh
Create the state directory:
mkdir -p /var/lib/healthcheck
systemd Configuration
Create the service unit:
vim /etc/systemd/system/healthcheck.service

[Unit]
Description=Basic server health check

[Service]
Type=oneshot
ExecStart=/usr/local/sbin/healthcheck.sh
Create the timer unit:
vim /etc/systemd/system/healthcheck.timer

[Unit]
Description=Run healthcheck every 5 minutes

[Timer]
OnBootSec=2min
OnUnitActiveSec=5min
AccuracySec=30s

[Install]
WantedBy=timers.target